Not just a game: Rugby World Cup per capita CO2 emissions
BY JOHN LANG
A day before the opening ceremony of this year’s Rugby World Cup in Japan — when ‘hagibis’ was still just the Tagalog word for ‘speed’ — Christian Aid released its first ever rugby report.
The organisation’s new sports vehicle, aptly named World in Disunion, was selected to steer its full beams on international climate justice. The premise was simple: responsibility for climate change sits chiefly on the shoulders of the world’s economic powerhouse, such as the USA, Canada and Japan. It does not sit on the shoulders of Samoa.
I had a thought — a rare occurrence on a Thursday evening. Hashed out in in a two-man scrum with ECIU director Richard Black, our resultant #RWCO2 concept — a play on the official #RWC2019 hashtag — would become our way of keeping the headlights (or floodlights) on during the whole tournament. #RWCO2 has offered you alternative head-to-head match-ups as the tournament progressed, based not on how teams clean out the ruck but how much they dirty up the atmosphere.
Let the scrum-down of per-capita emissions begin!
Showdowns of epic ill-proportions
The second game of the Cup gave us an early taste of the scale of inequity at play.
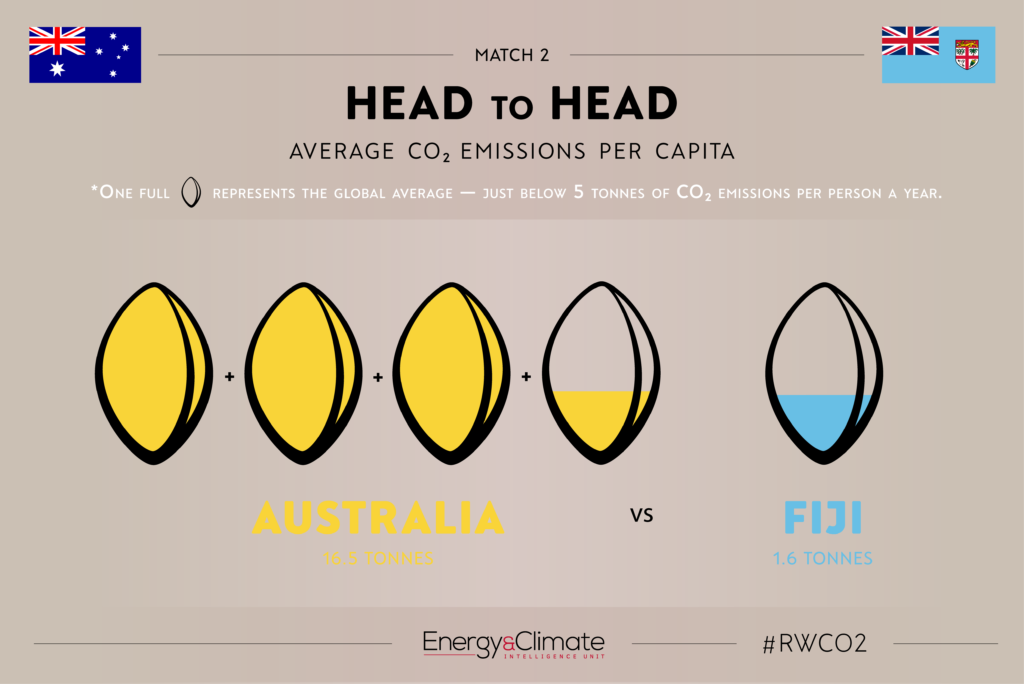
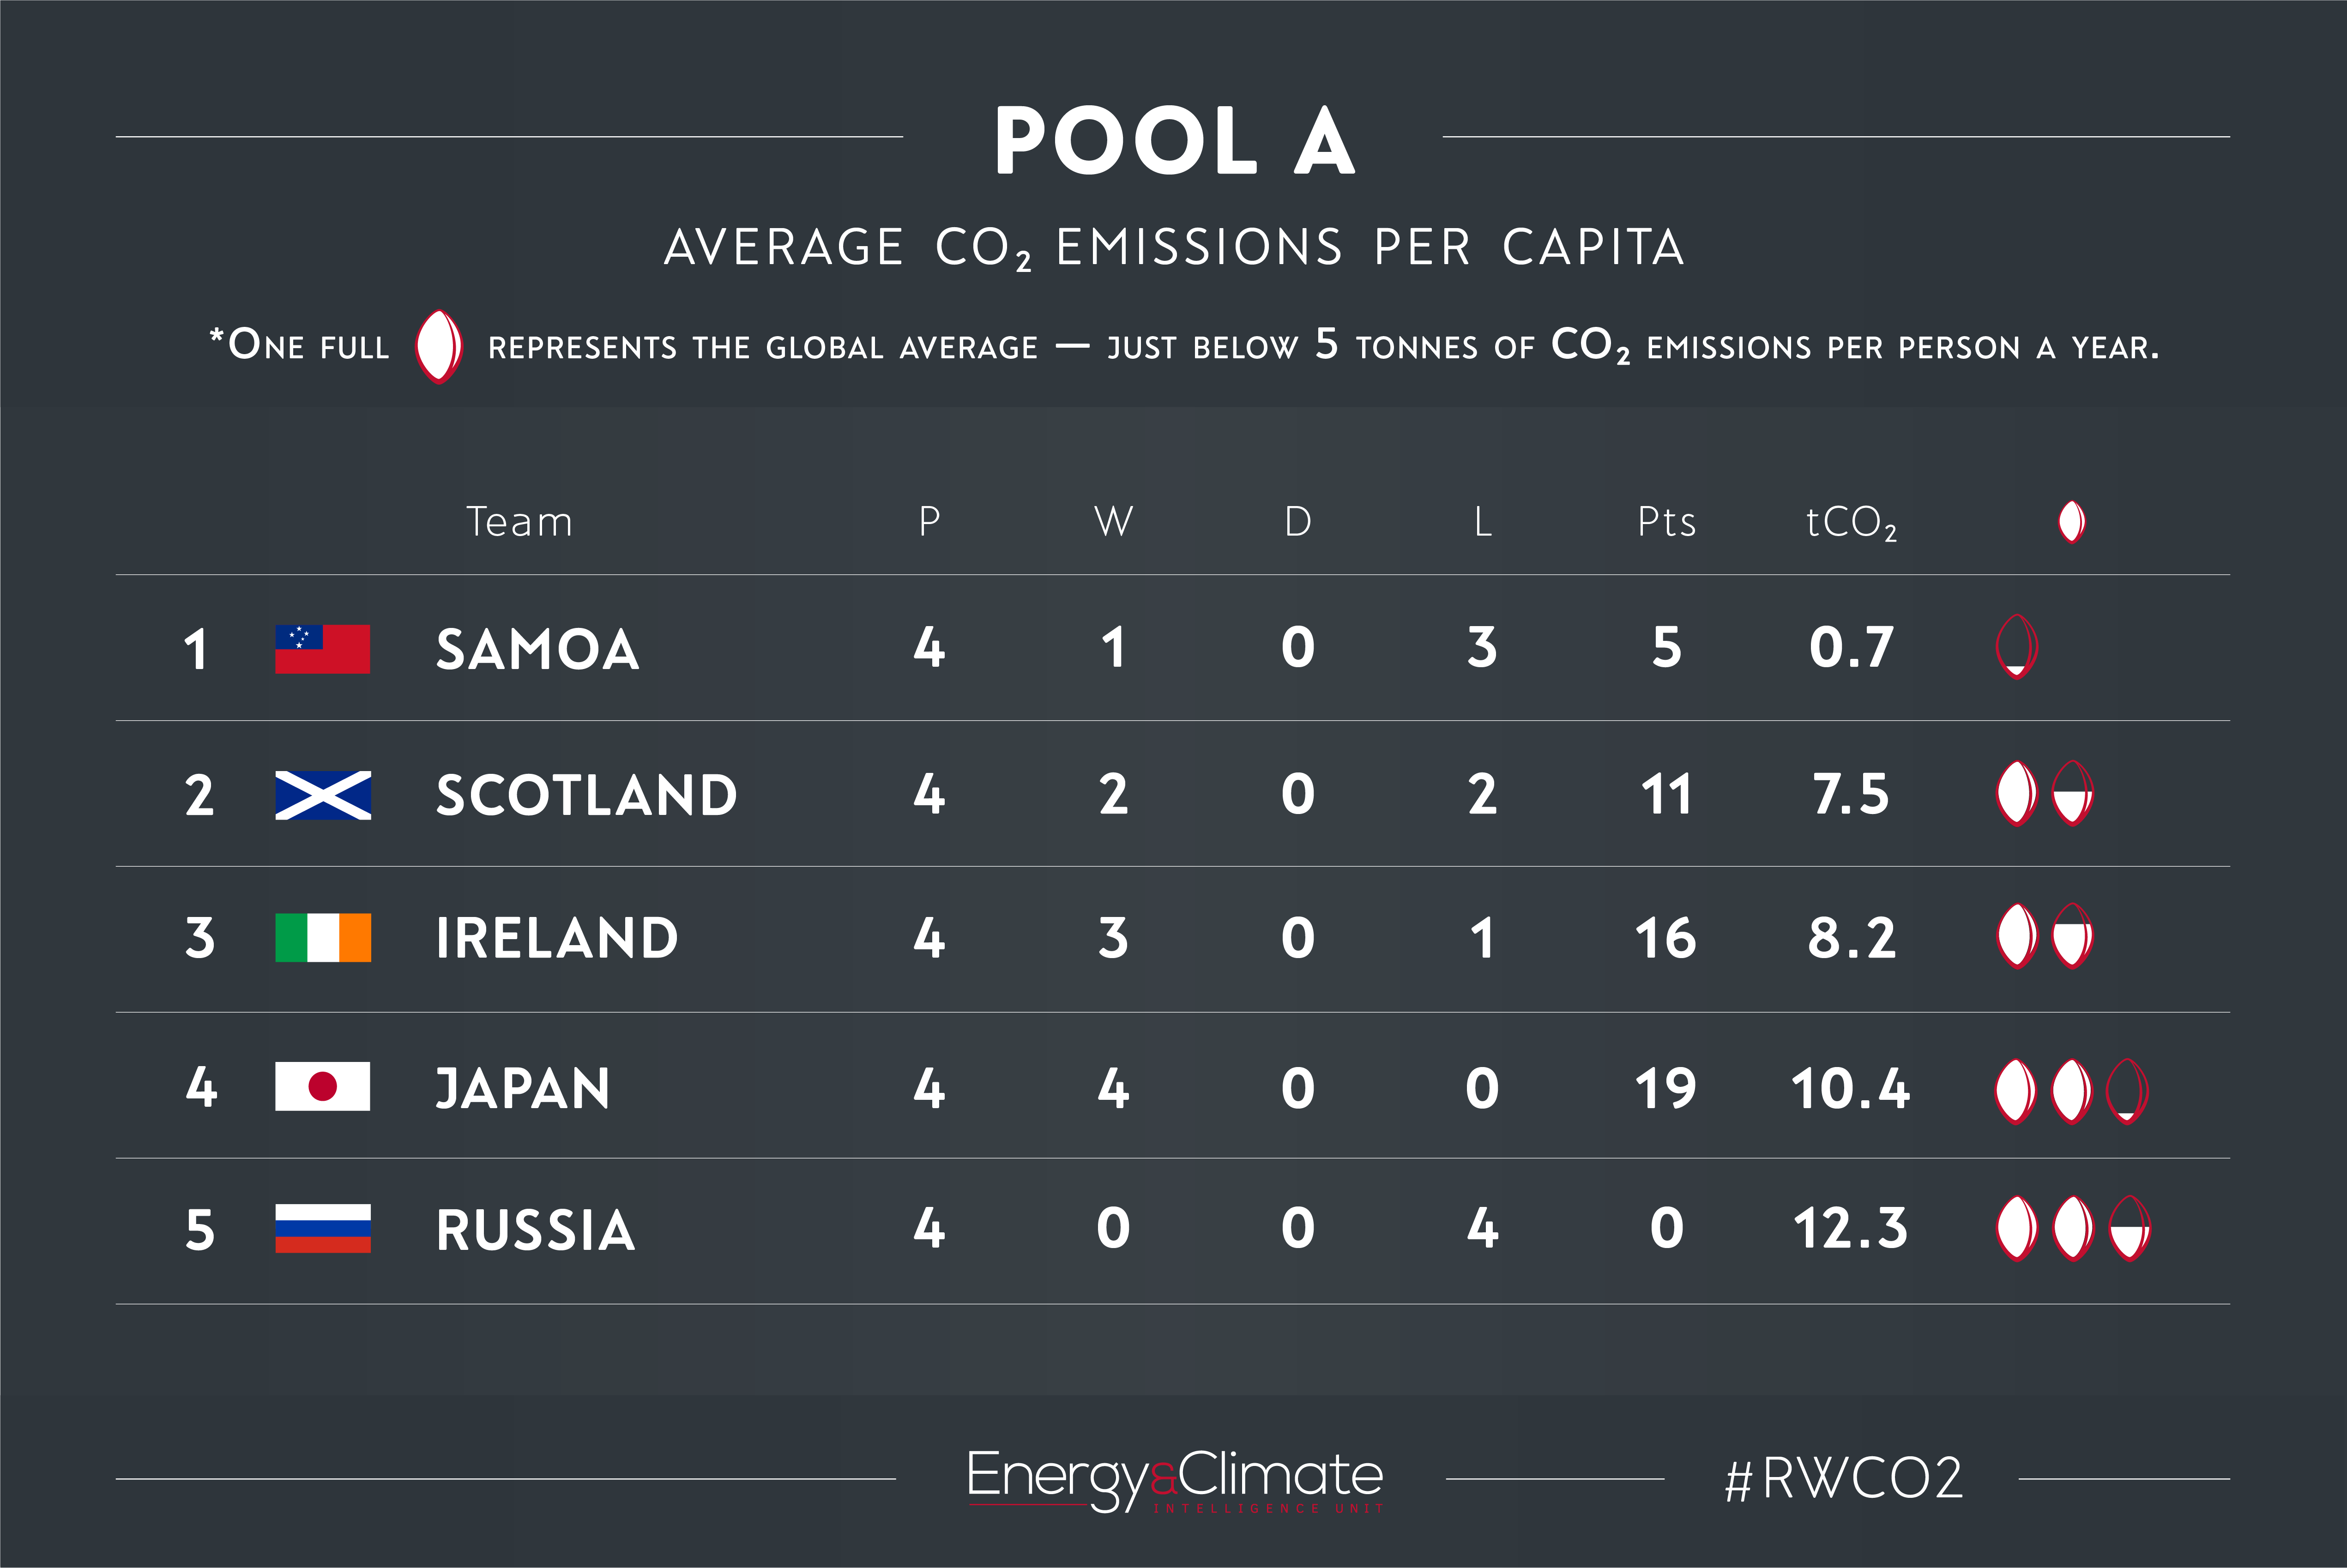
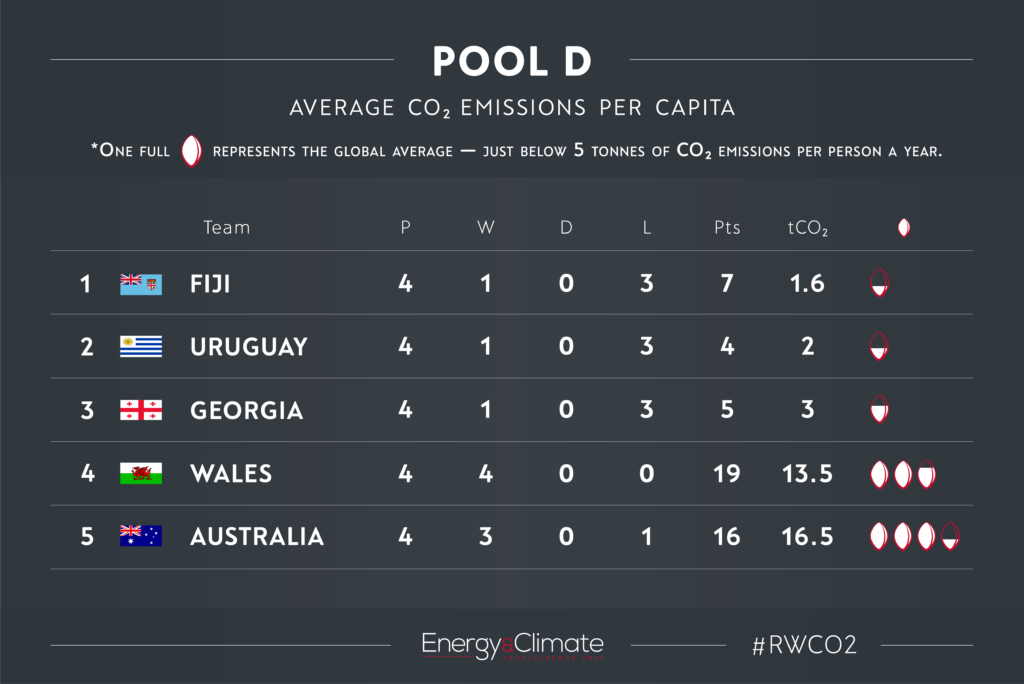
Pacific island nations punch well above their weight in rugby (as Fiji did in this particular game against Australia), but not when it comes to carbon output. Representing the 38-nation Small Island Developing States (SIDS) bloc, Samoa (at 0.7 tonnes per capita), Tonga (1.3) and Fiji (1.6) are among the smallest carbon contributors in the world.
They are also some of the most climate-vulnerable nations, having contributed virtually nothing to cause their plight. Climate change threatens the land they inhabit, the economies they depend on and the protein they fish for. Like a slow motion replay of a spear tackle, whatever the path the international community takes from here, coral reefs are set to all but disappear this century. Sea-levels will continue their indomitable advance for many centuries, likely millennia, to come.
But conditional hope exists: if the world can limit global warming to around 1.5°C, the Pacific islands and other low-lying nations will be spared the worst impacts of climate change. For SIDS, the successful attempt to get the 1.5°C target (Article 2) included in the Paris Agreement text was a matter of long-term survival. So too were the bitterly fought ‘Loss and Damage’ provisions (Article 8), which recognise inevitable and inconvenient future realities, such as certain SIDS’ displacement from sea-level rise.
The giants of #RWCO2
So who are the heavyweights in the Rugby World Cup’s per-capita emissions table?
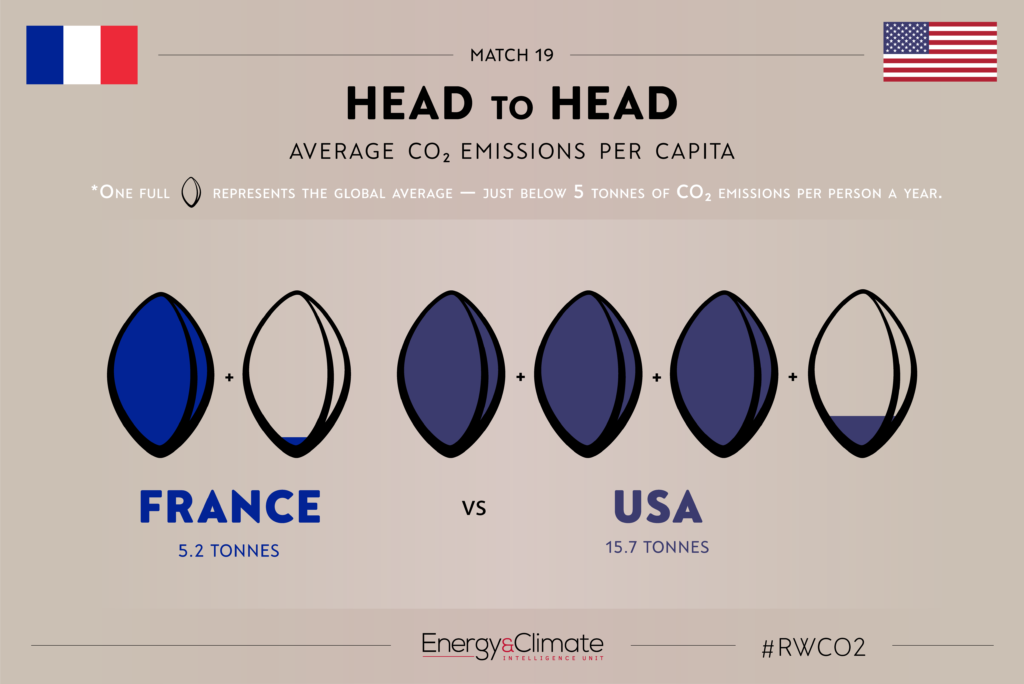
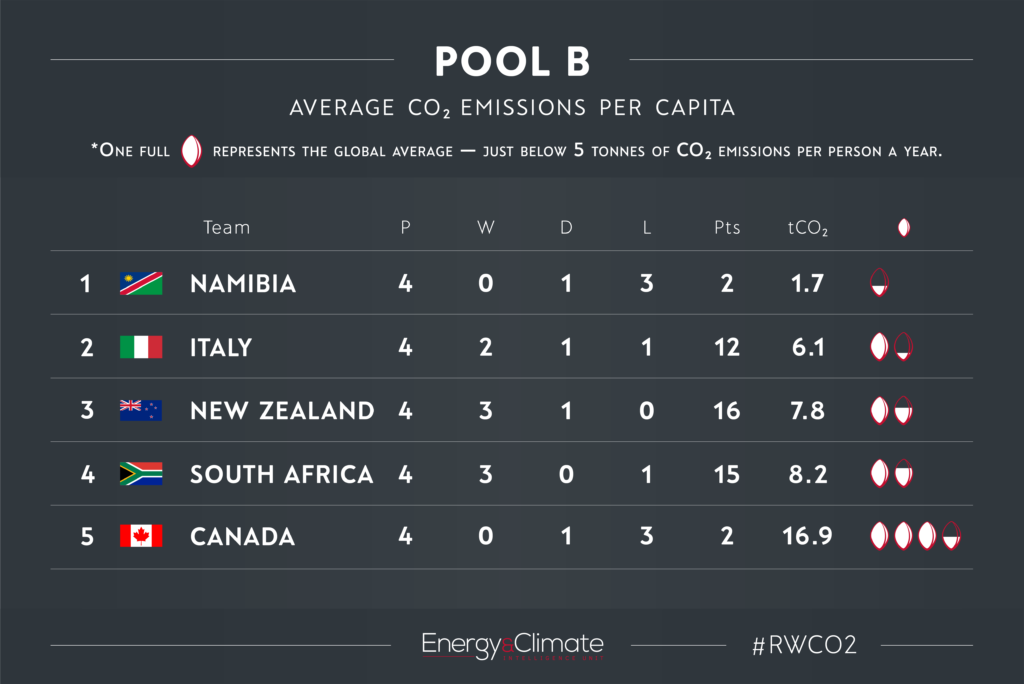
In the top tier, Russia (12.3 tonnes per capita) and hosts Japan (10.4) join a troublesome trio of Canada (16.9), Australia (16.5) and the USA (15.7). Then there’s Wales (13.5), which is there or thereabouts.
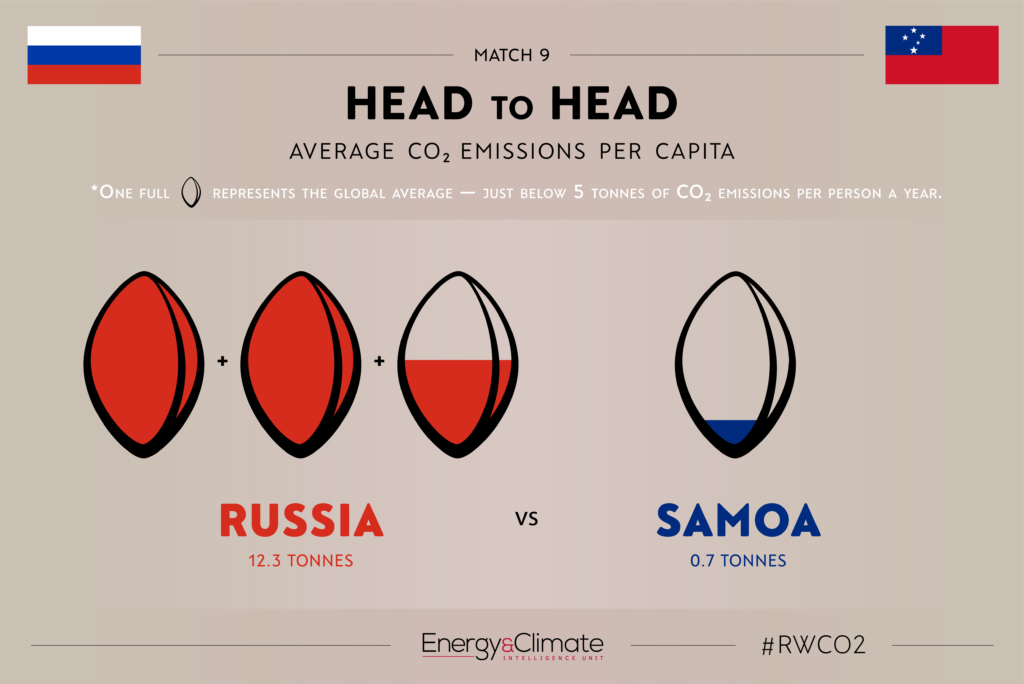
Russia: At leisurely pace, the Russian team now accepts the long-term economic consequences of climate change. It’s less concerned, however, over the short-to-medium term. This seems strange given that a global transition to net zero spells the end of foreign dependence on Russian oil and gas. Last time it was tested, Russia’s energy sector accounted for 87.3% of all emissions (without land use, land use change and forestry). Meanwhile, the nation came dead last in the renewable energy stakes in the most recent report of the Climate Change Performance Index.
Japan: Eight years after Fukushima, the hosts have 40 nuclear reactors (about 40GW) sitting idle. Fossil fuels have strolled into the gap. Japan’s current coal plant construction plans, which could add 15 GW more of coal power, remain a major concern. Energy policy aside, Japan has set a long-term strategy to reach net zero emissions ‘as early as possible during the second half of the 21st century’. But for that commitment to turn into credible policy, Japan has some important near-term selections to make.
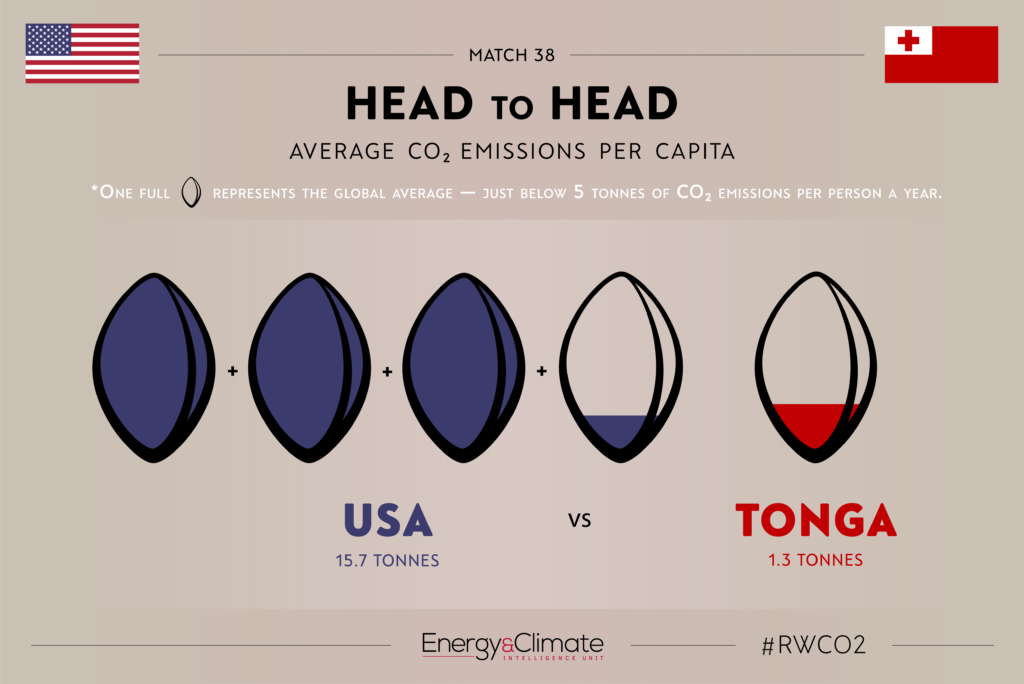
The US: The injection of more wind, sun and gas into the electric US backline has helped net emissions decline 12% from 2005 to 2017. But recent gains have come undone, and fast. Coach Trump’s deregulatory game plan has replaced the Obama-era Clean Power Plan that was finding its feet. Coal has lost market form, but is still projected to account for 22% of electricity generation in 2030. To make matters worse, in 2018, the US overtook Russia and Saudi Arabia to become the world’s largest producer of crude oil. Much hope lies in the individual players themselves, who are taking unilateral action. For example, star-player California has set a net zero by 2045 target in law, which includes an interim target to power California by 50% renewables by 2025. Other players promise to follow suit.
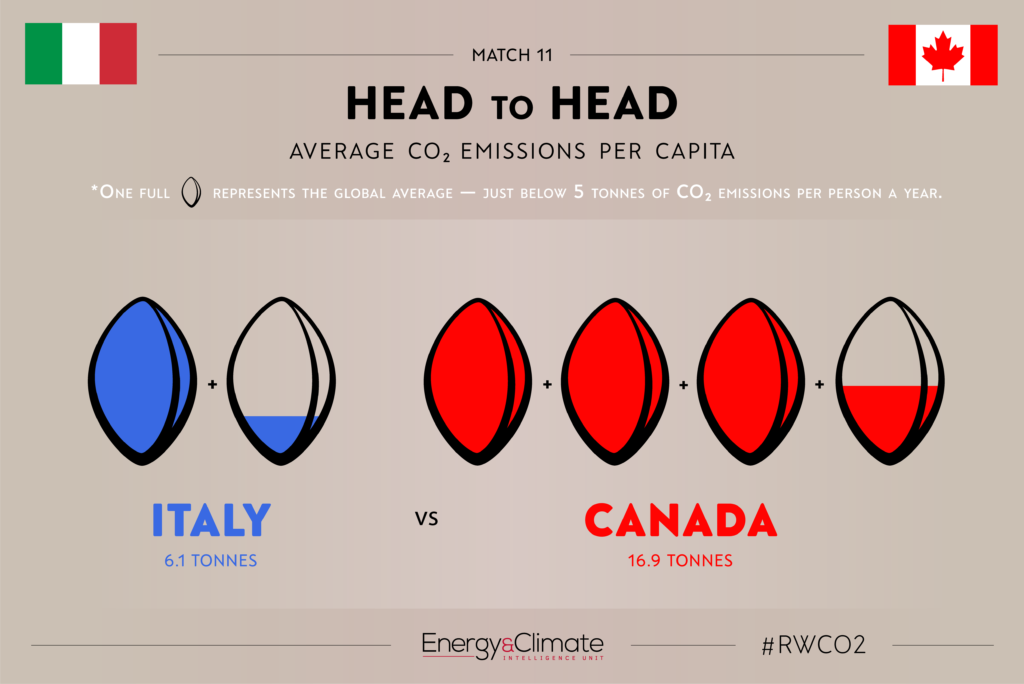
Canada: While Canada’s coal consumption has plummeted in recent years, the brown stuff still makes up almost 10% of electricity generation. Increasing upstream oil and gas transportation and road transportation also team up to mean over 80% of the team’s GHG emissions come from energy production. Canadian players are notorious for their use of more energy due to ‘extreme temperatures’, a ‘vast landscape’ and a ‘dispersed team’.
Australia: The coal-fired and petrol-headed Australian team is a waltzing contradiction. A drought of players made way for a flood, and then they fire-d on all cylinders. Australia is by no means a stranger to extreme weather, but amid record temperatures across the board and a long losing streak to boot, business as usual from the government simply flies in the face of reality. There has been no indication Australia will replace coal-fired players for renewable ones — coal still accounts for 75% of Australia’s electricity generation, and to rub insult into injury, the Aussies are the world’s largest exporter of coal.
Some surprising suspects
Wales
Very recently, off-field progress has reflected on-field success. But that has not always been the case. The semi-finalists struggled to accelerate decarbonisation as much as other UK teams, mostly as a result of having a larger share of industry. In the power sector, the veteran Aberthaw coal power station has been a workhorse, but its best days are now behind it. Earmarked as the dirtiest player in Welsh history, Aberthaw has even been called out by the judiciary in 2016 for emitting illegal levels of pollution. It was dealt a yellow card in 2016, and a red in 2019.
More recently, the reduced profitability of coal generation has helped curb power sector emissions. Since 2016, emissions have plummeted, helping Wales to a 13.2% decrease in overall emissions during the 2017 season alone, romping away from the rest of the UK.
New Zealand
The All Blacks have been selecting renewable electricity-producing sources from a geographically diverse and geologically endowed pool of talent for years: geothermal, hydro, wind and solar. Tall turbines, burly hydro and explosive geothermal creates electrifying speed and power all over the park.
Renewables make up 82% of electricity generation in New Zealand. But — 60% of the All Blacks energy is still derived from fossil fuels. In fact, New Zealand uses around 49 million barrels of crude oil every year — more than 1,600 litres of crude oil per person, per year and enough oil to fill the country’s Wellington Stadium (the ‘Cake Tin’) 13 times.
While NZ’s backline is generally regarded as more damaging than a cow’s burp, in any given year, that burp makes up almost one third of New Zealand’s annual emissions. When nitrous oxide from fertilizers and animal excreta is added, the agriculture sector accounts for about half of New Zealand’s greenhouse gas emissions.
Vive le France!
All things considered, the fission-powered French side had formidable form coming into the tournament. In a vision considerably more unified and consistent than the coaching team’s, France’s nuclear reactor fleet, providing about three-quarters of its electricity, is the major reason why its per-capita emissions are lower than RWC19’s other developed nations.
The post-Fukushima world initially had France threatening to cut nuclear power production from 75% to 50% by 2025. But in late 2017,the cull was put on ice for a decade. According to new coach Emmanuel Macron, rearranging his team’s priorities so that decarbonisation was front and centre necessitated a fresh game plan. In practice, that meant prematurely retiring all coal-fired power players from the squad and encouraging opponents to do the same. Added to which, earlier this year, just one day after the UK competed the feat, France legislated for net zero emissions by 2050.
Final pool play results: a pattern emerges
In Pool A, clear daylight stood between Samoa and the developed nations, with all the other four teams emitting at least 10 times more per capita than the Pacific minnows. The race for second and last place was a tighter contest. Russia may have finally ratified the Paris Agreement, but the absence of any serious attempt at climate action leaves it in last place, and looking likely to remain there in four years time.
In Pool B, Namibia tops the table at a canter, its per-capita emissions roughly one-quarter of second-placed Italy. Only recently Namibia became one of a small number of African countries to commit to net zero carbon emissions by 2050. The languishing losers, Canada, have re-elected their coach, but good-by-the-climate alternatives were lacking.
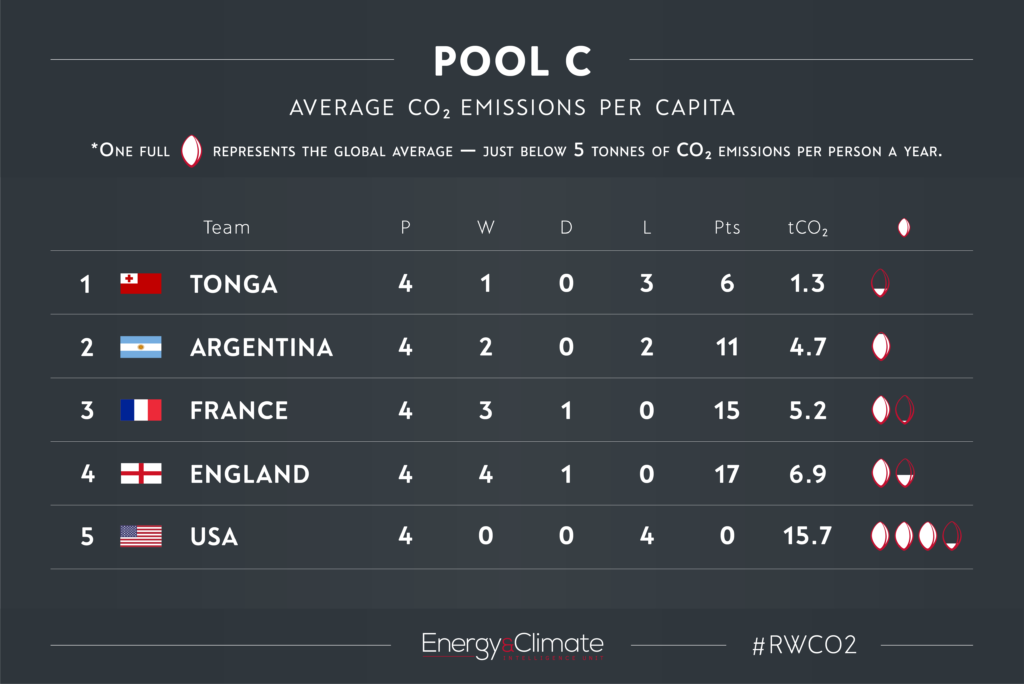
In Pool C, the USA has never been a ‘shining city upon a hill’ in the rugby world, or in climate terms. But with next year’s selection of a new coach, anything’s possible. All Democratic players have put climate at the top of the policy list to tackle.
Finally, in Pool D, Fiji won out in a tight race with fellow high-achievers Uruguay and Georgia, and as predicted, the wooden spoon was awarded to the Wallabies. In no other pool was the pattern so clear: the two worst climate offenders were the winners, but not of #RWCO2. In fact, in all four pools, the two teams to go through to the playoffs were drawn from the top three per capita emitters.
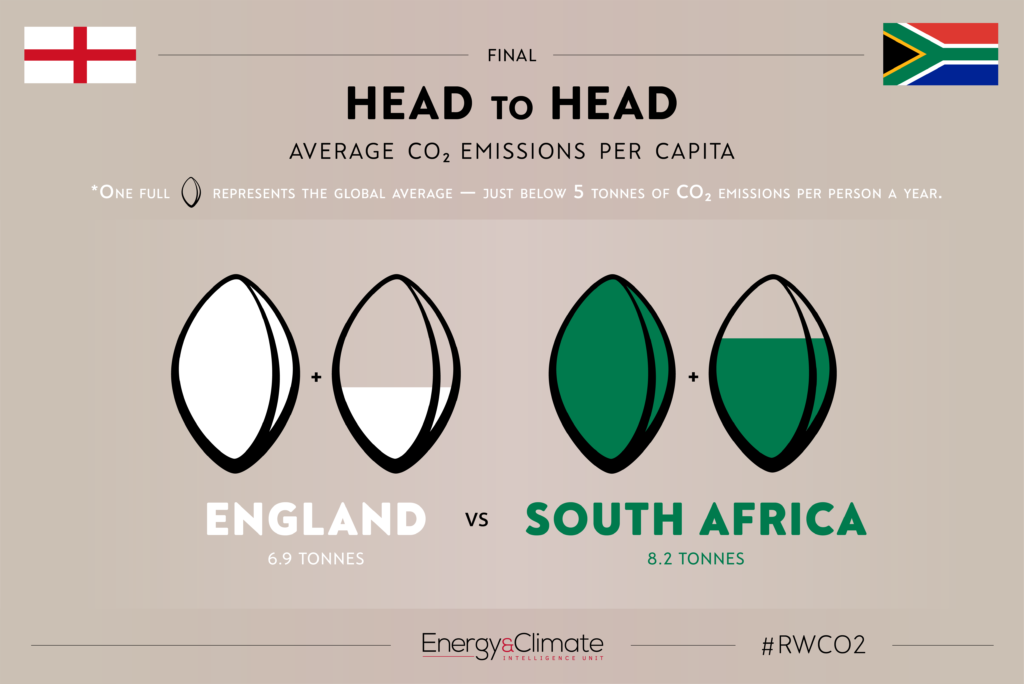
Ahead now lies only the final, and what a carefully-balanced match-up that appears to be. The South African pack boasts a behemoth-sized fleet of coal-fired power stations while England is shedding the legacy for quicker-stepping wind turbines and solar panels, while the England authorities are struggling to find a low-carbon route through congested traffic. Different histories, similar emissions, different strategies. Which will prove the winner, in the cup final and in climate change?