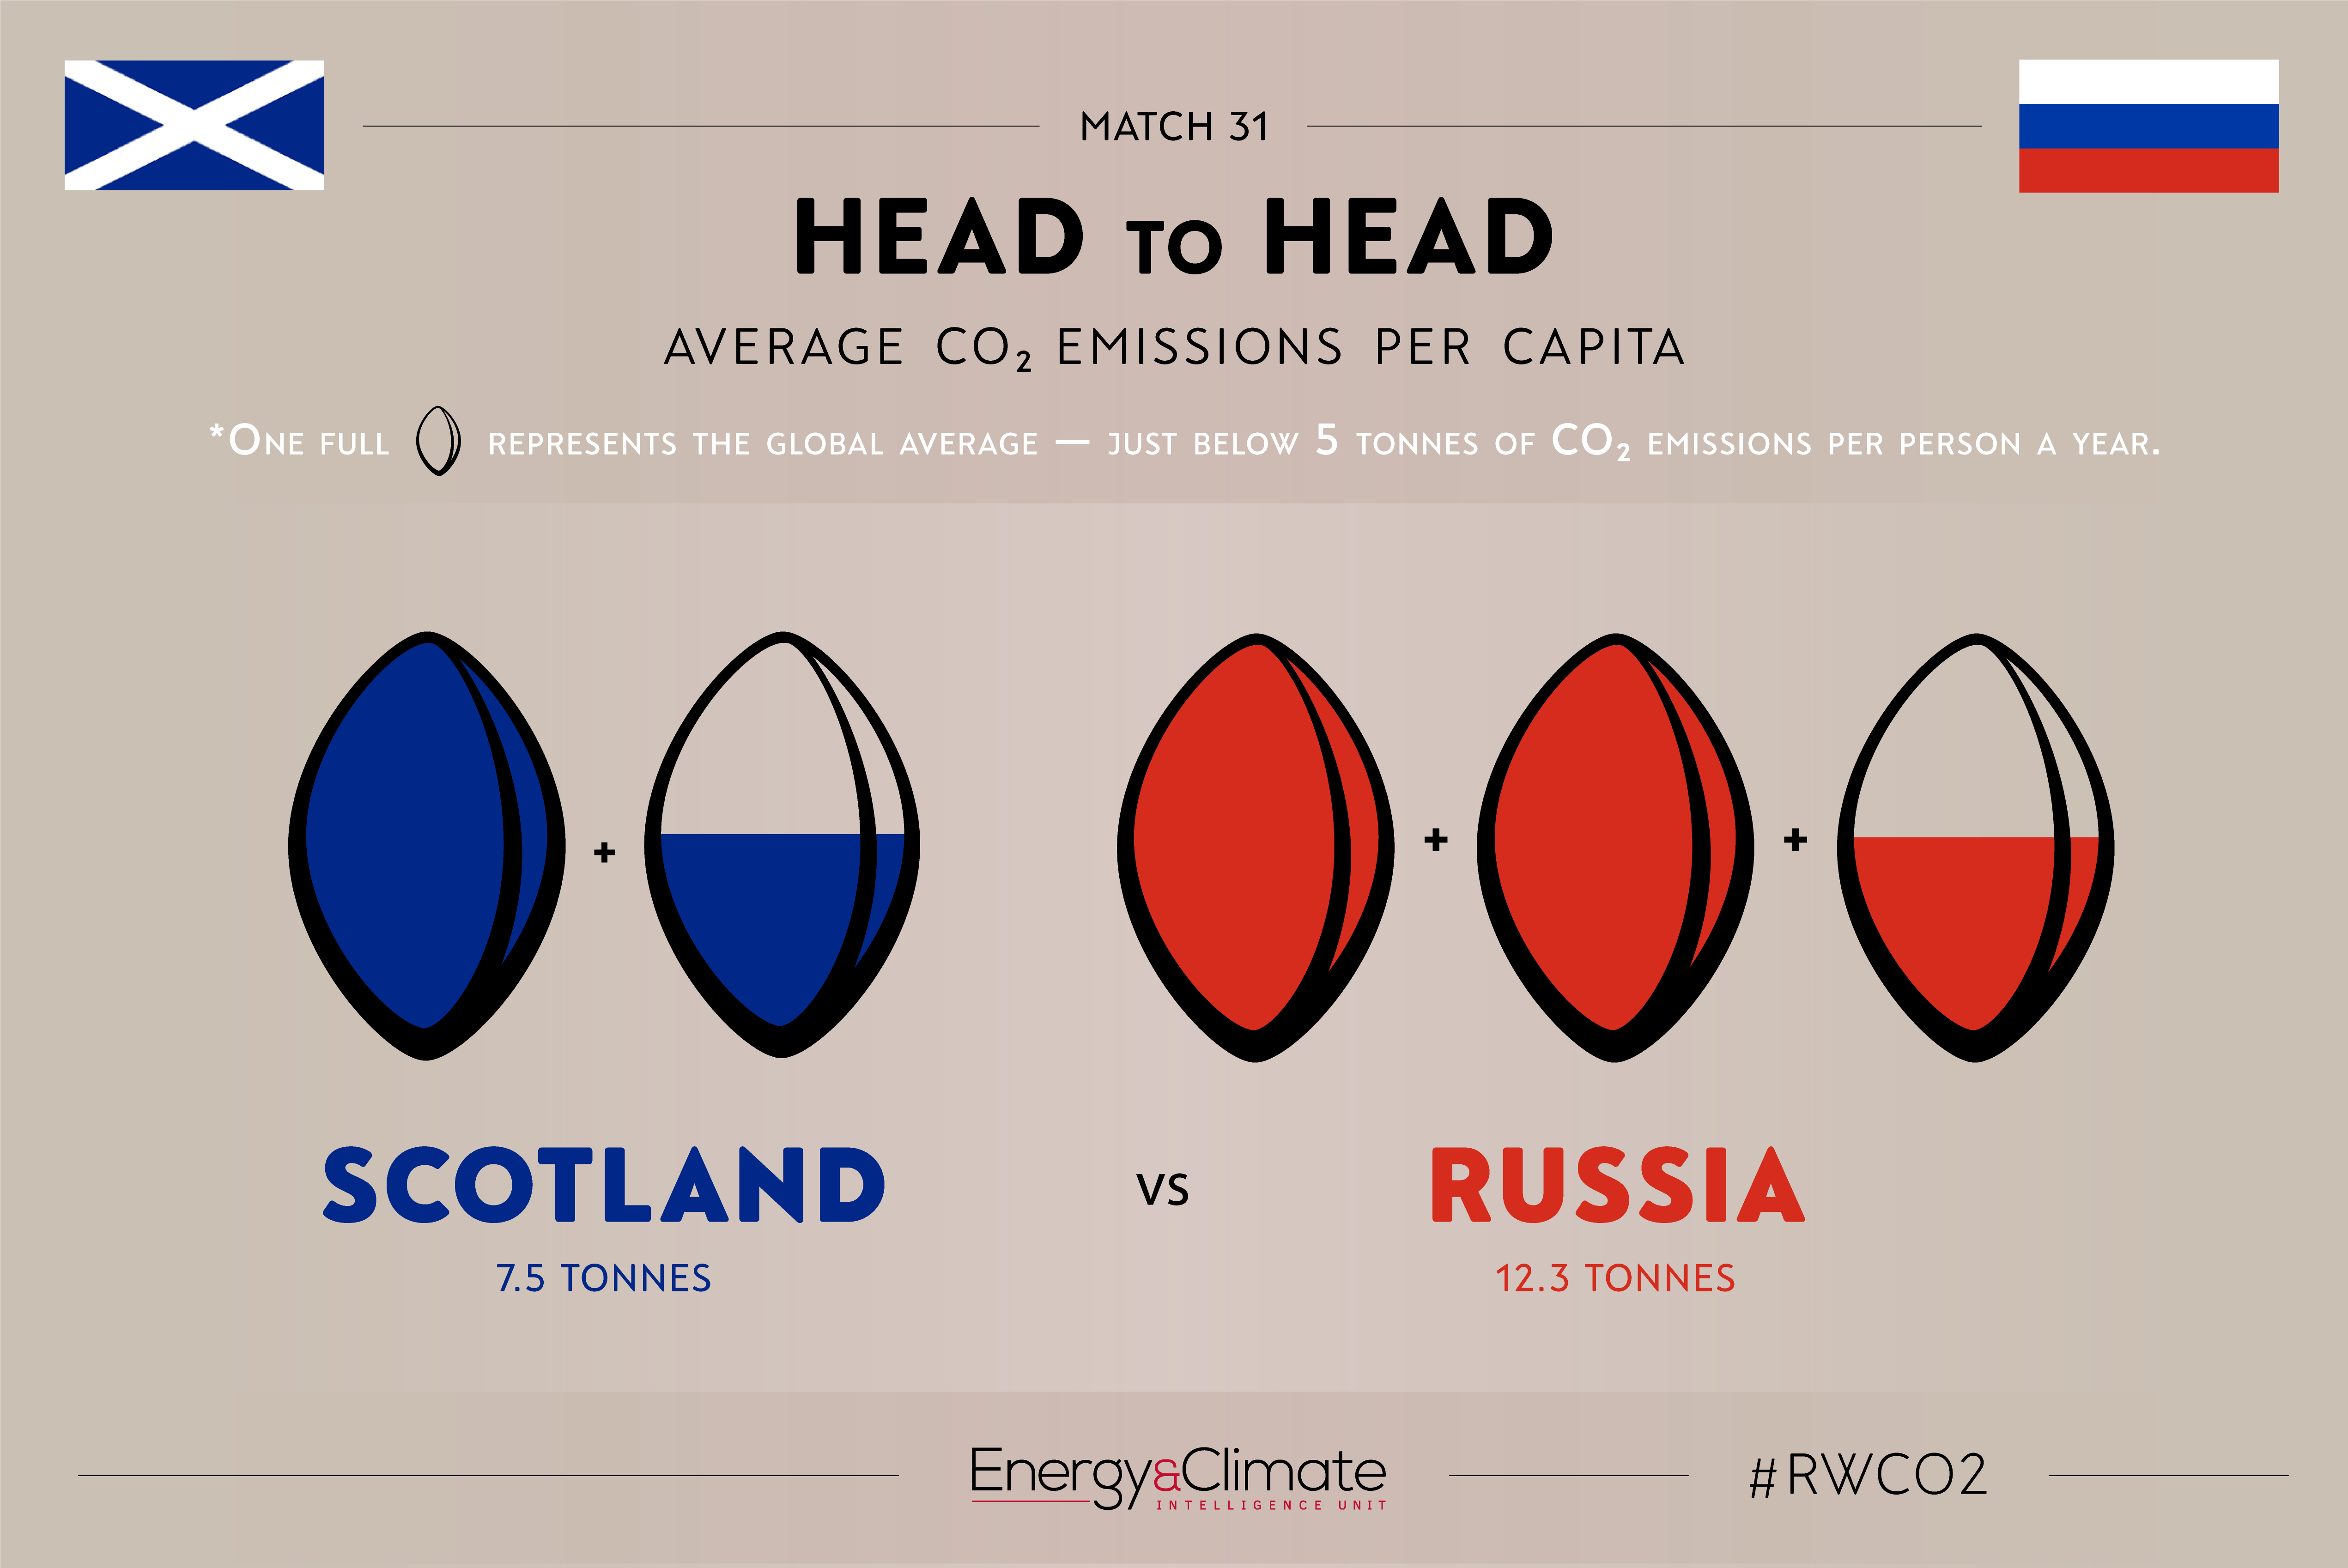
Head to Head: Part Four of #RWCO2
BY JOHN LANG
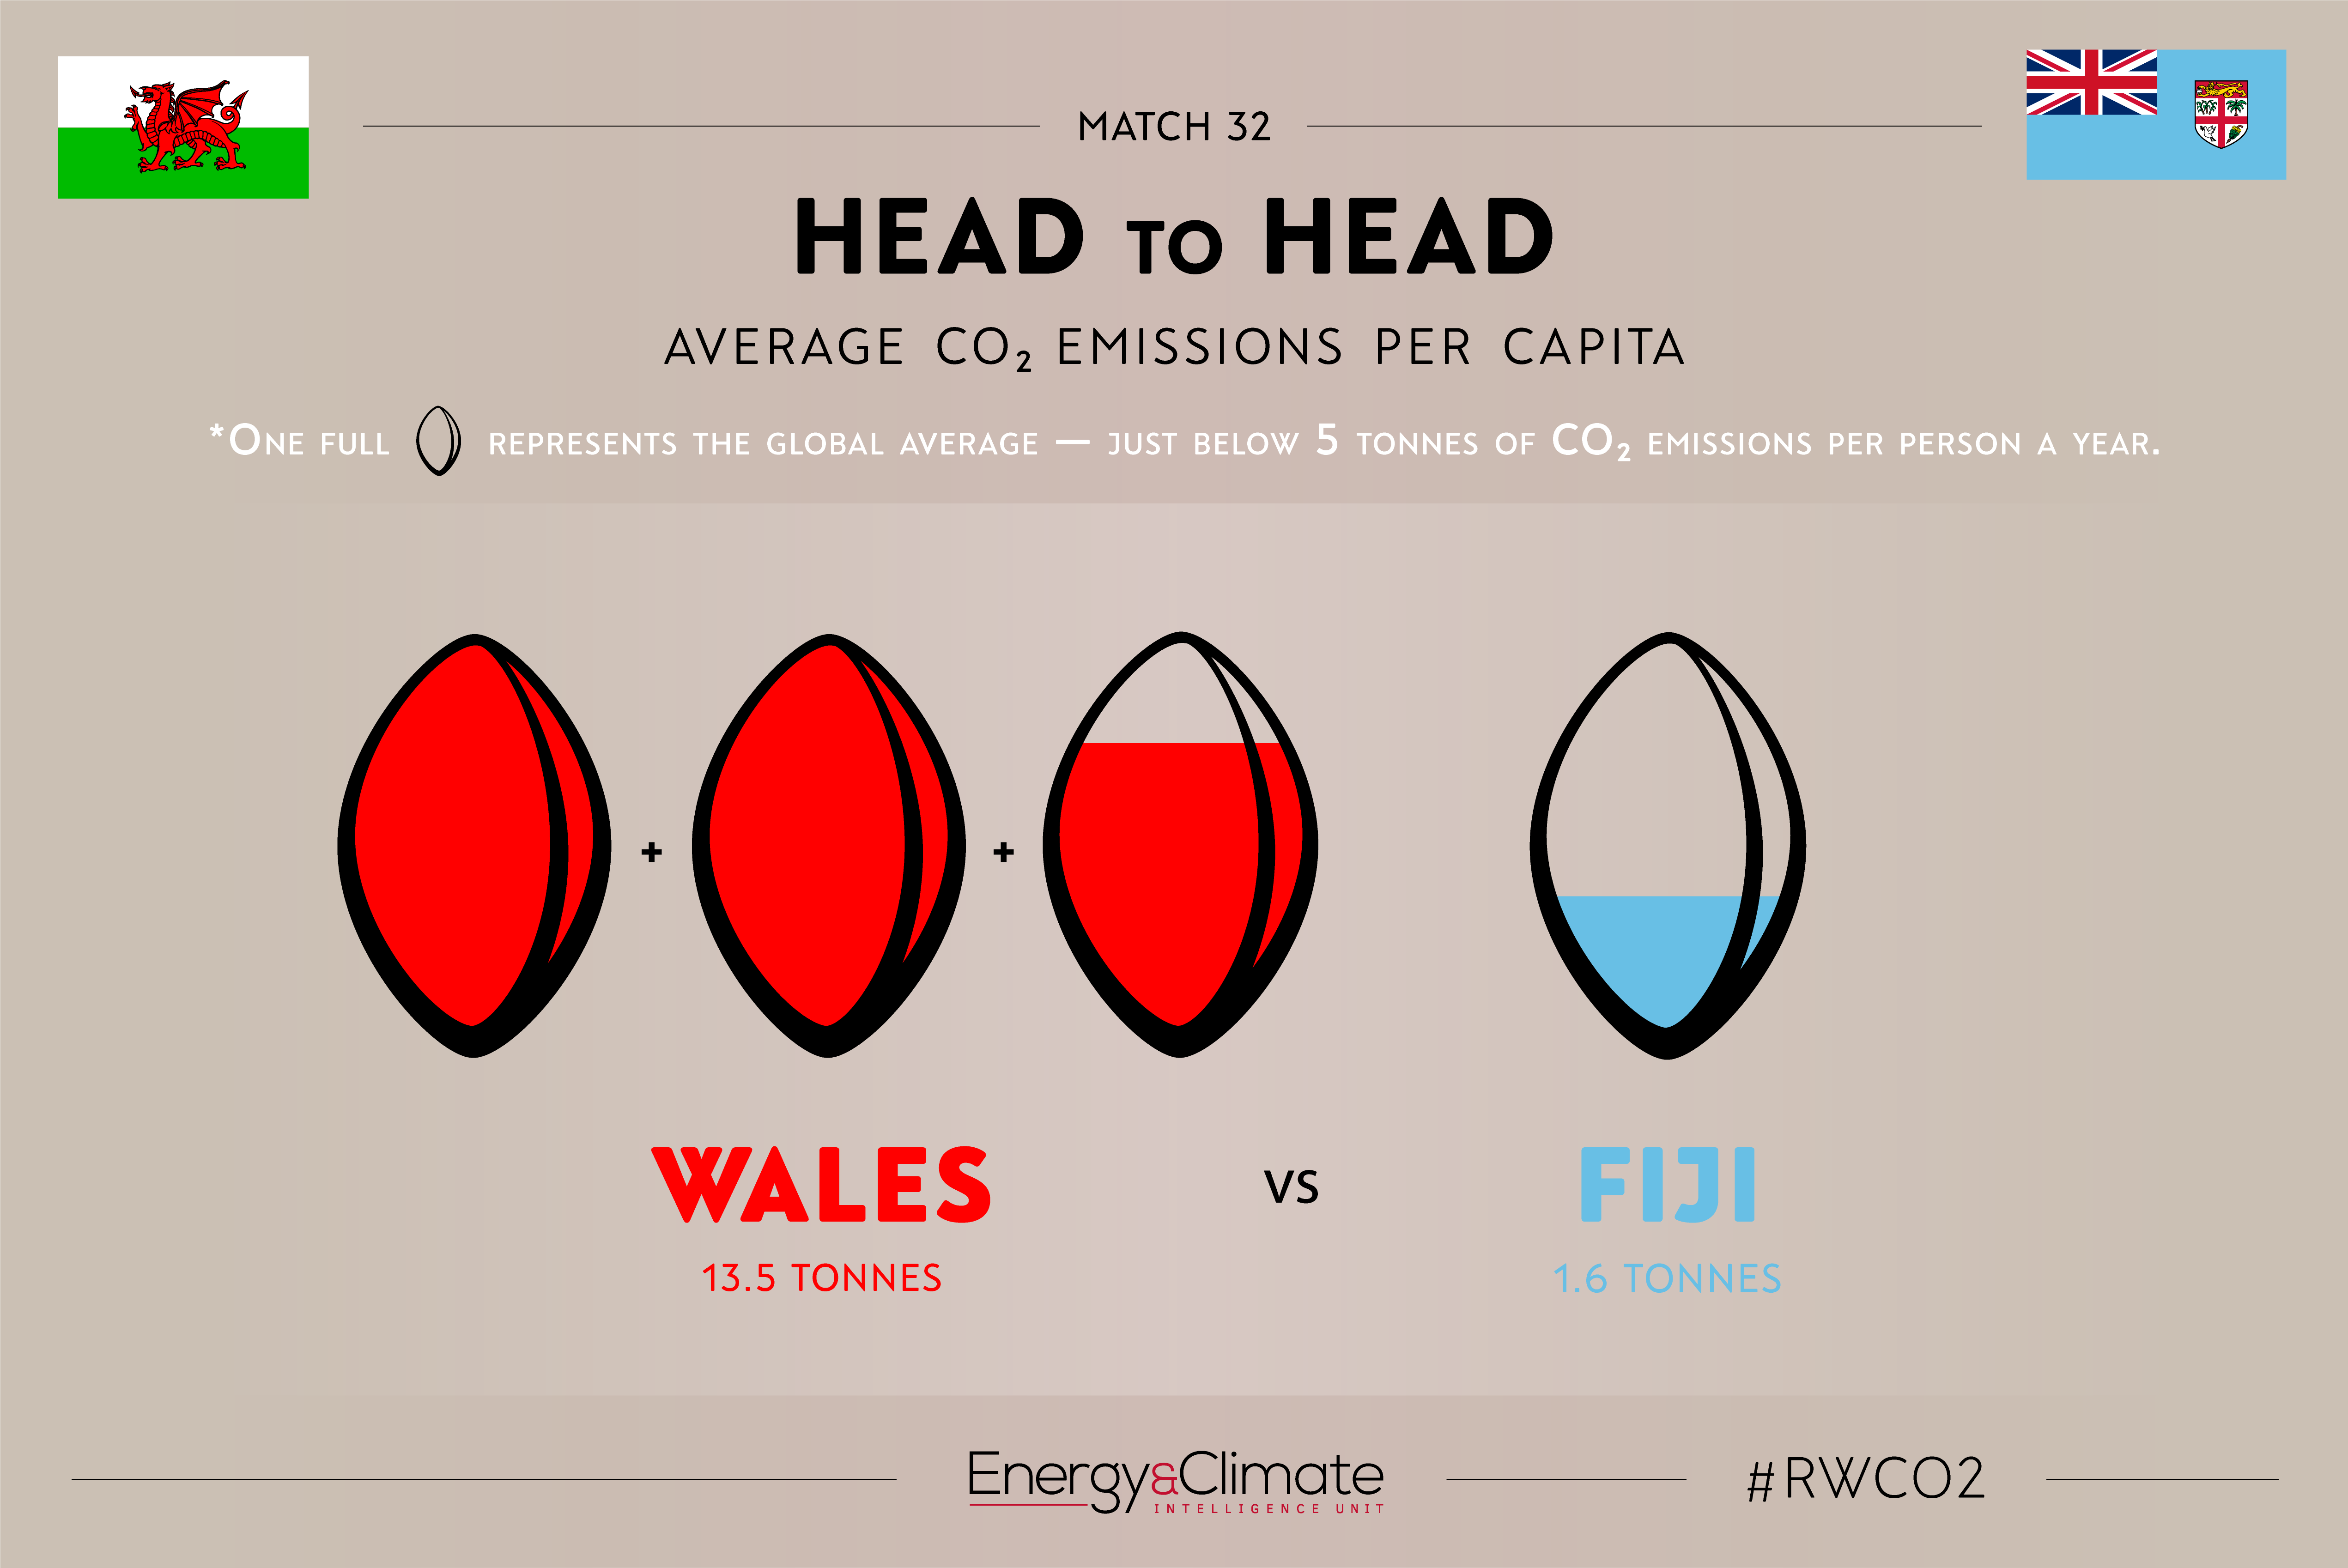
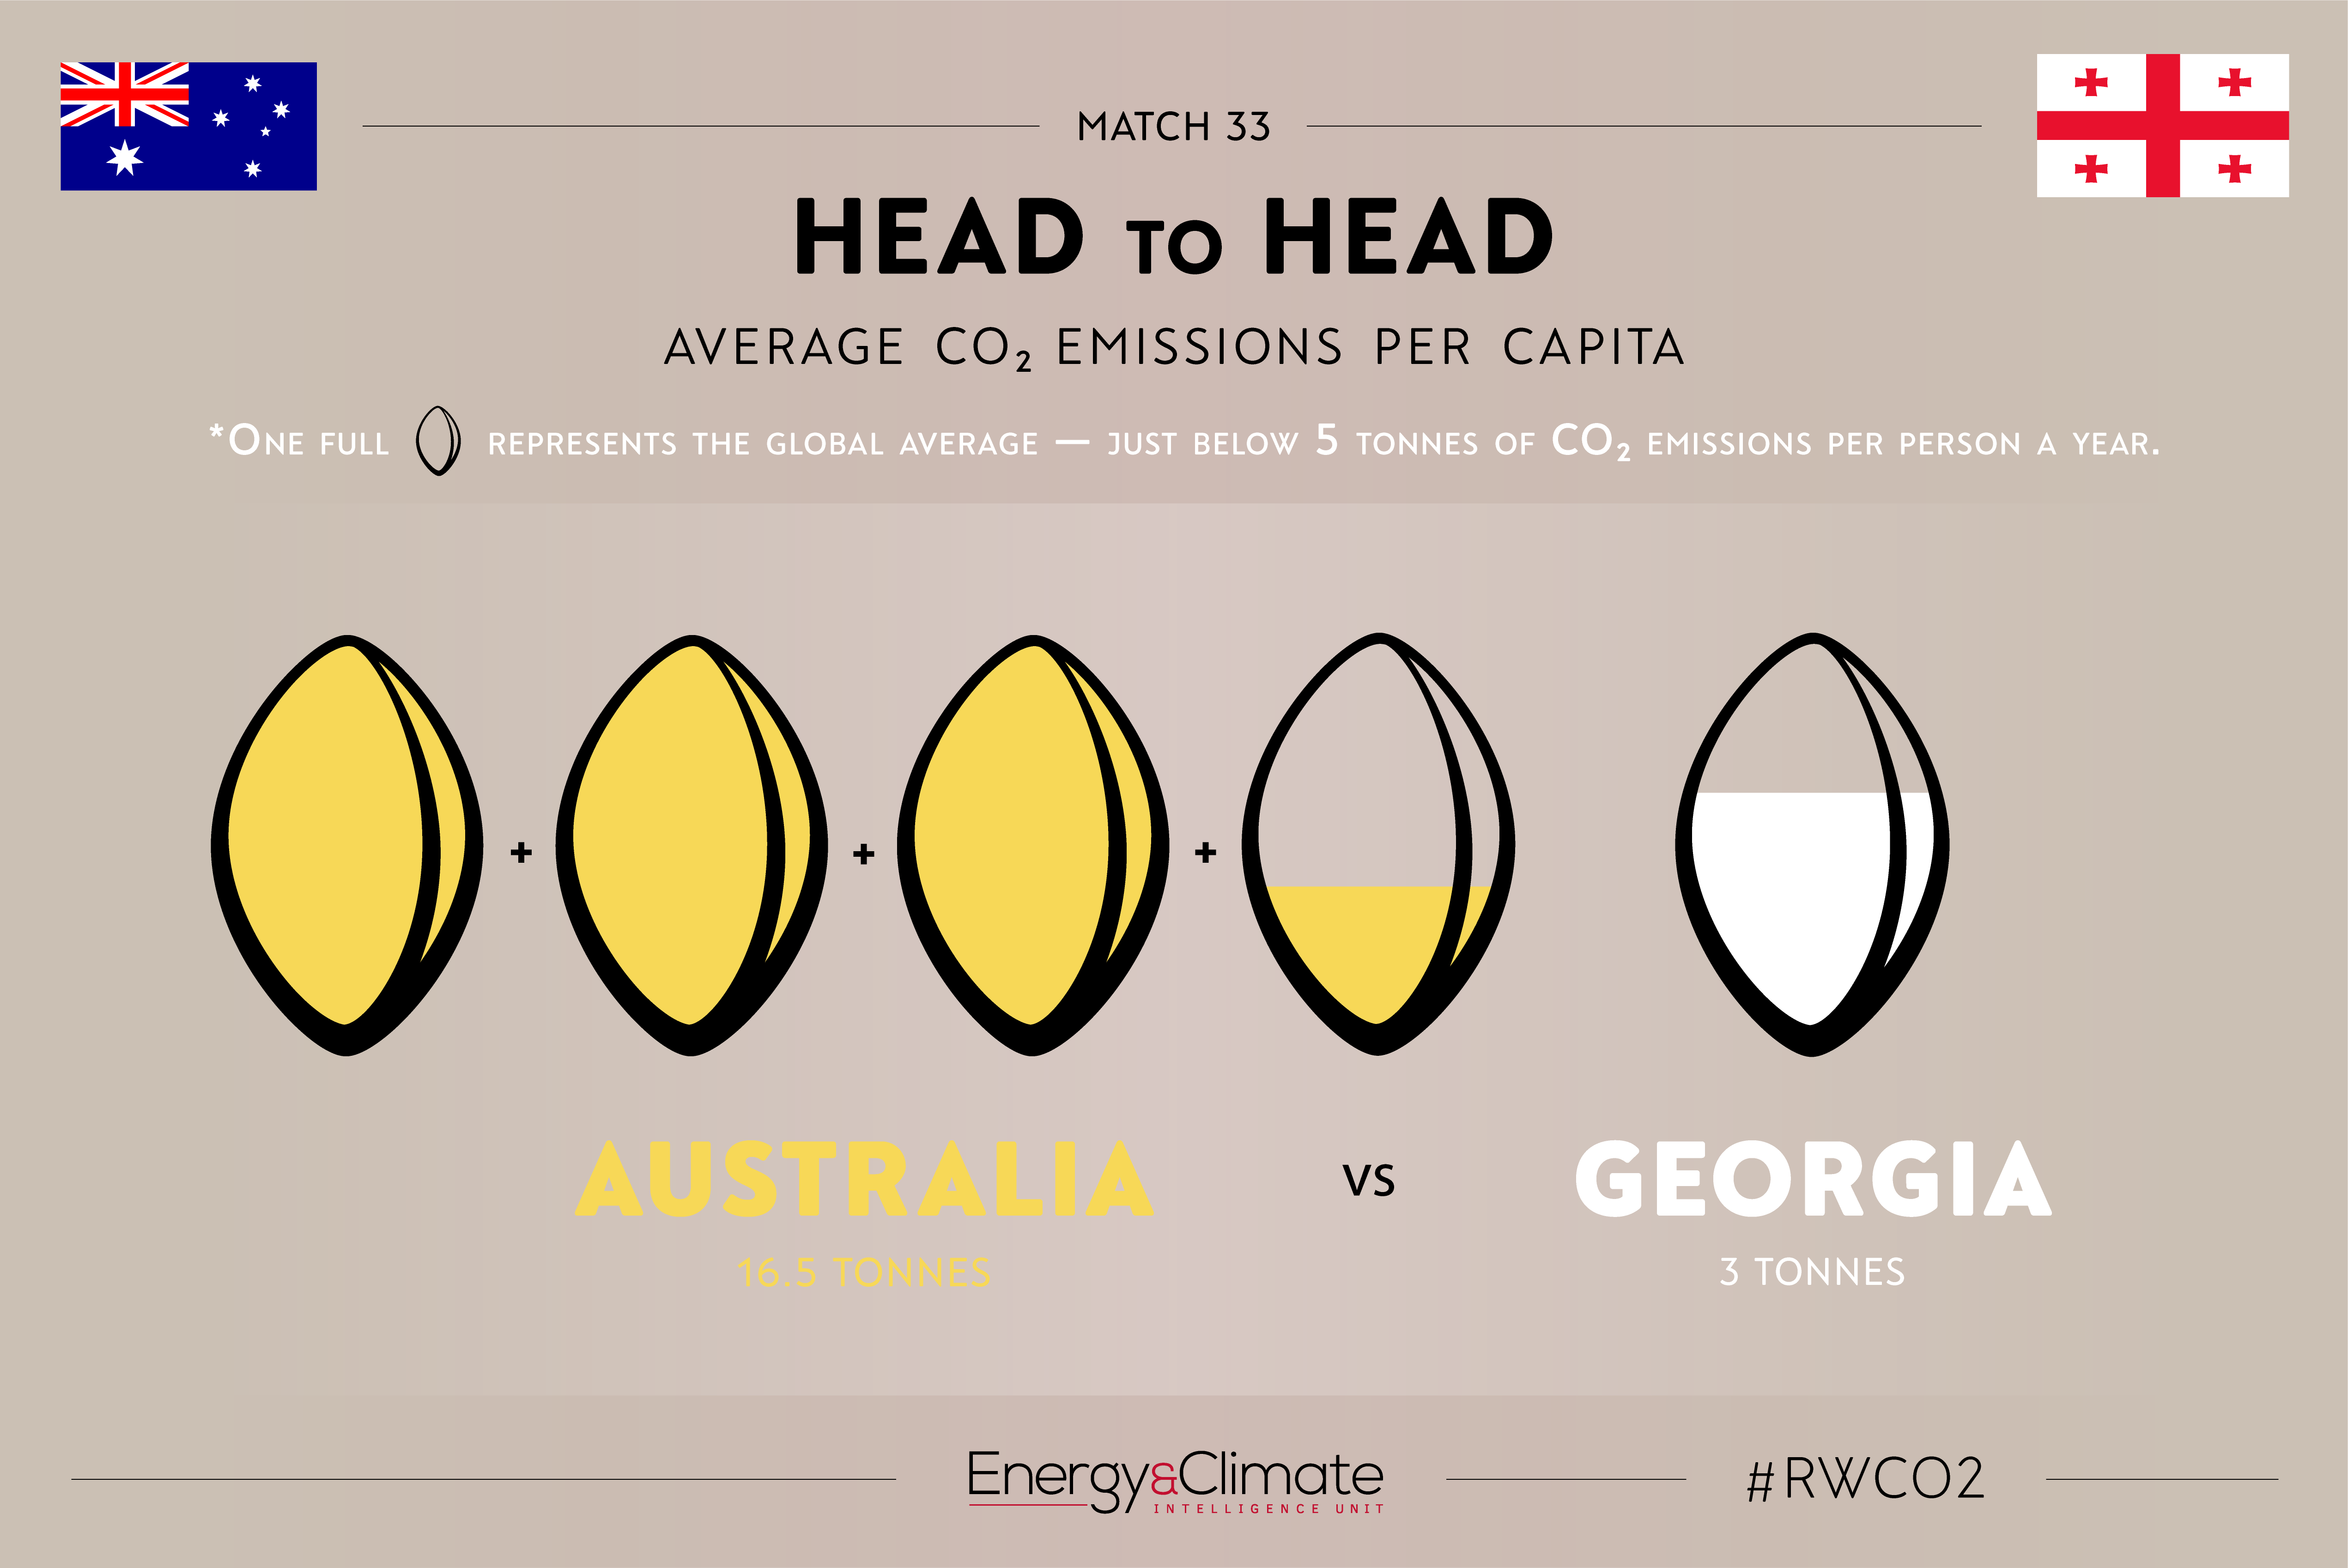
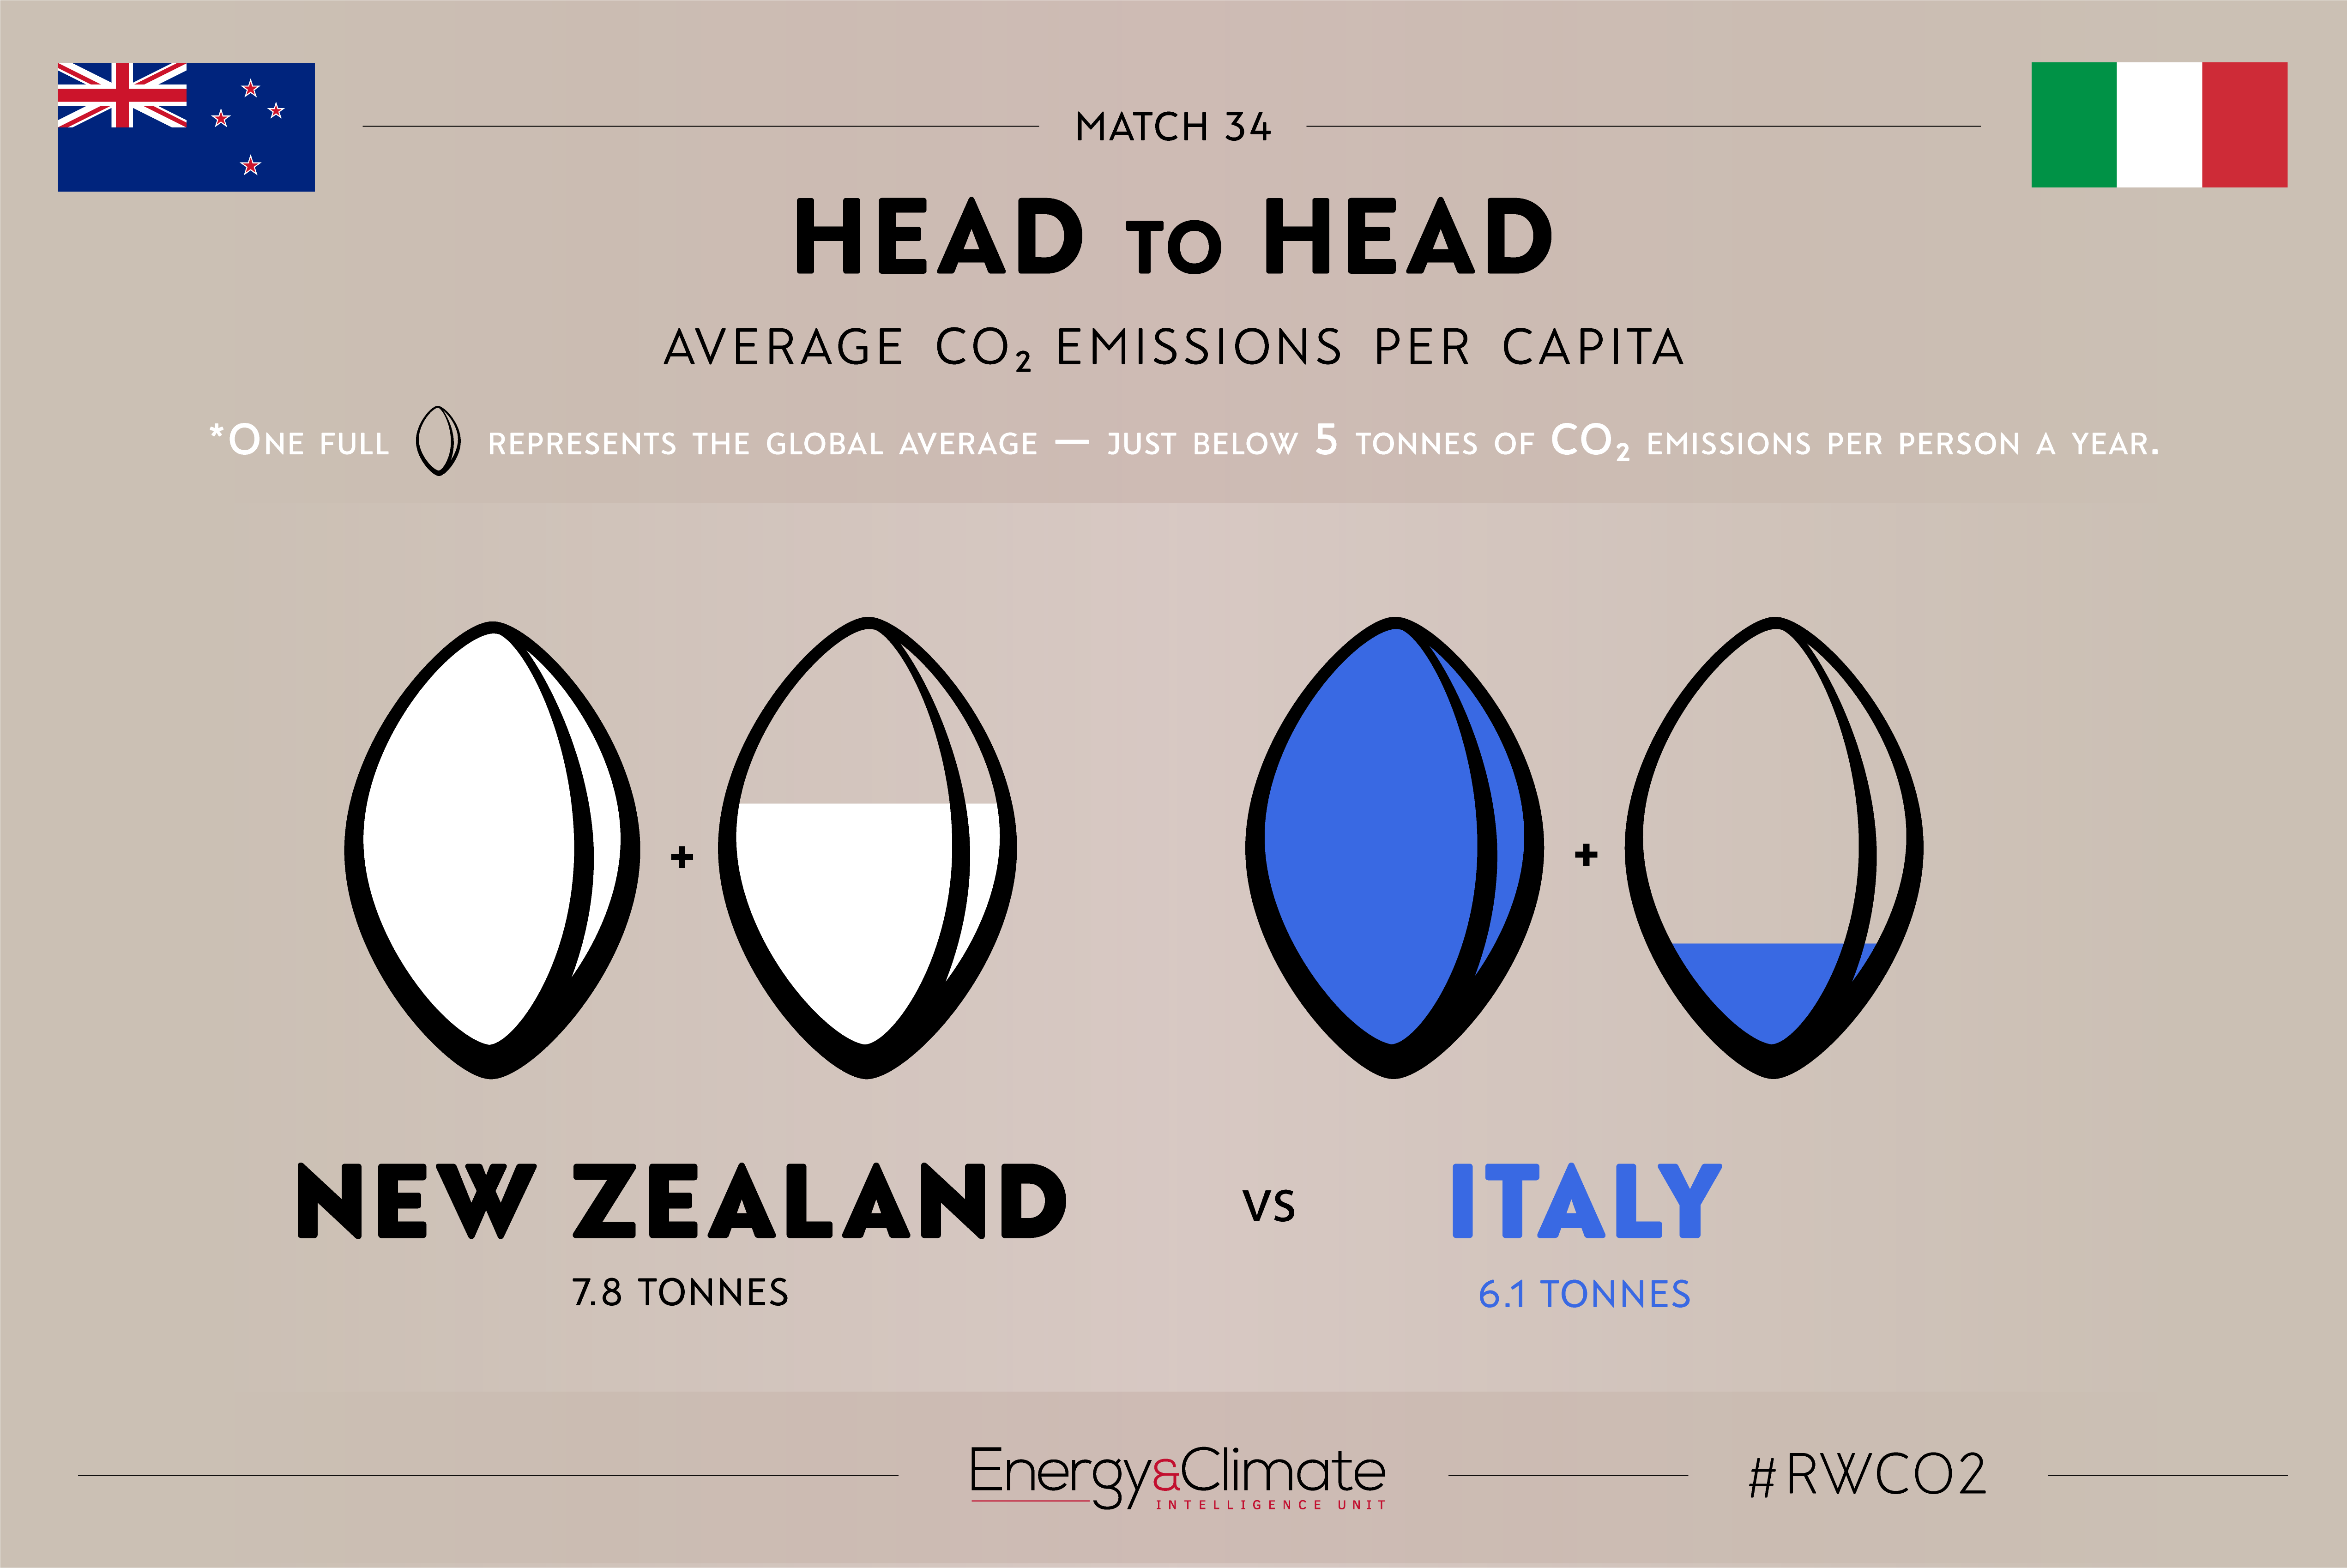
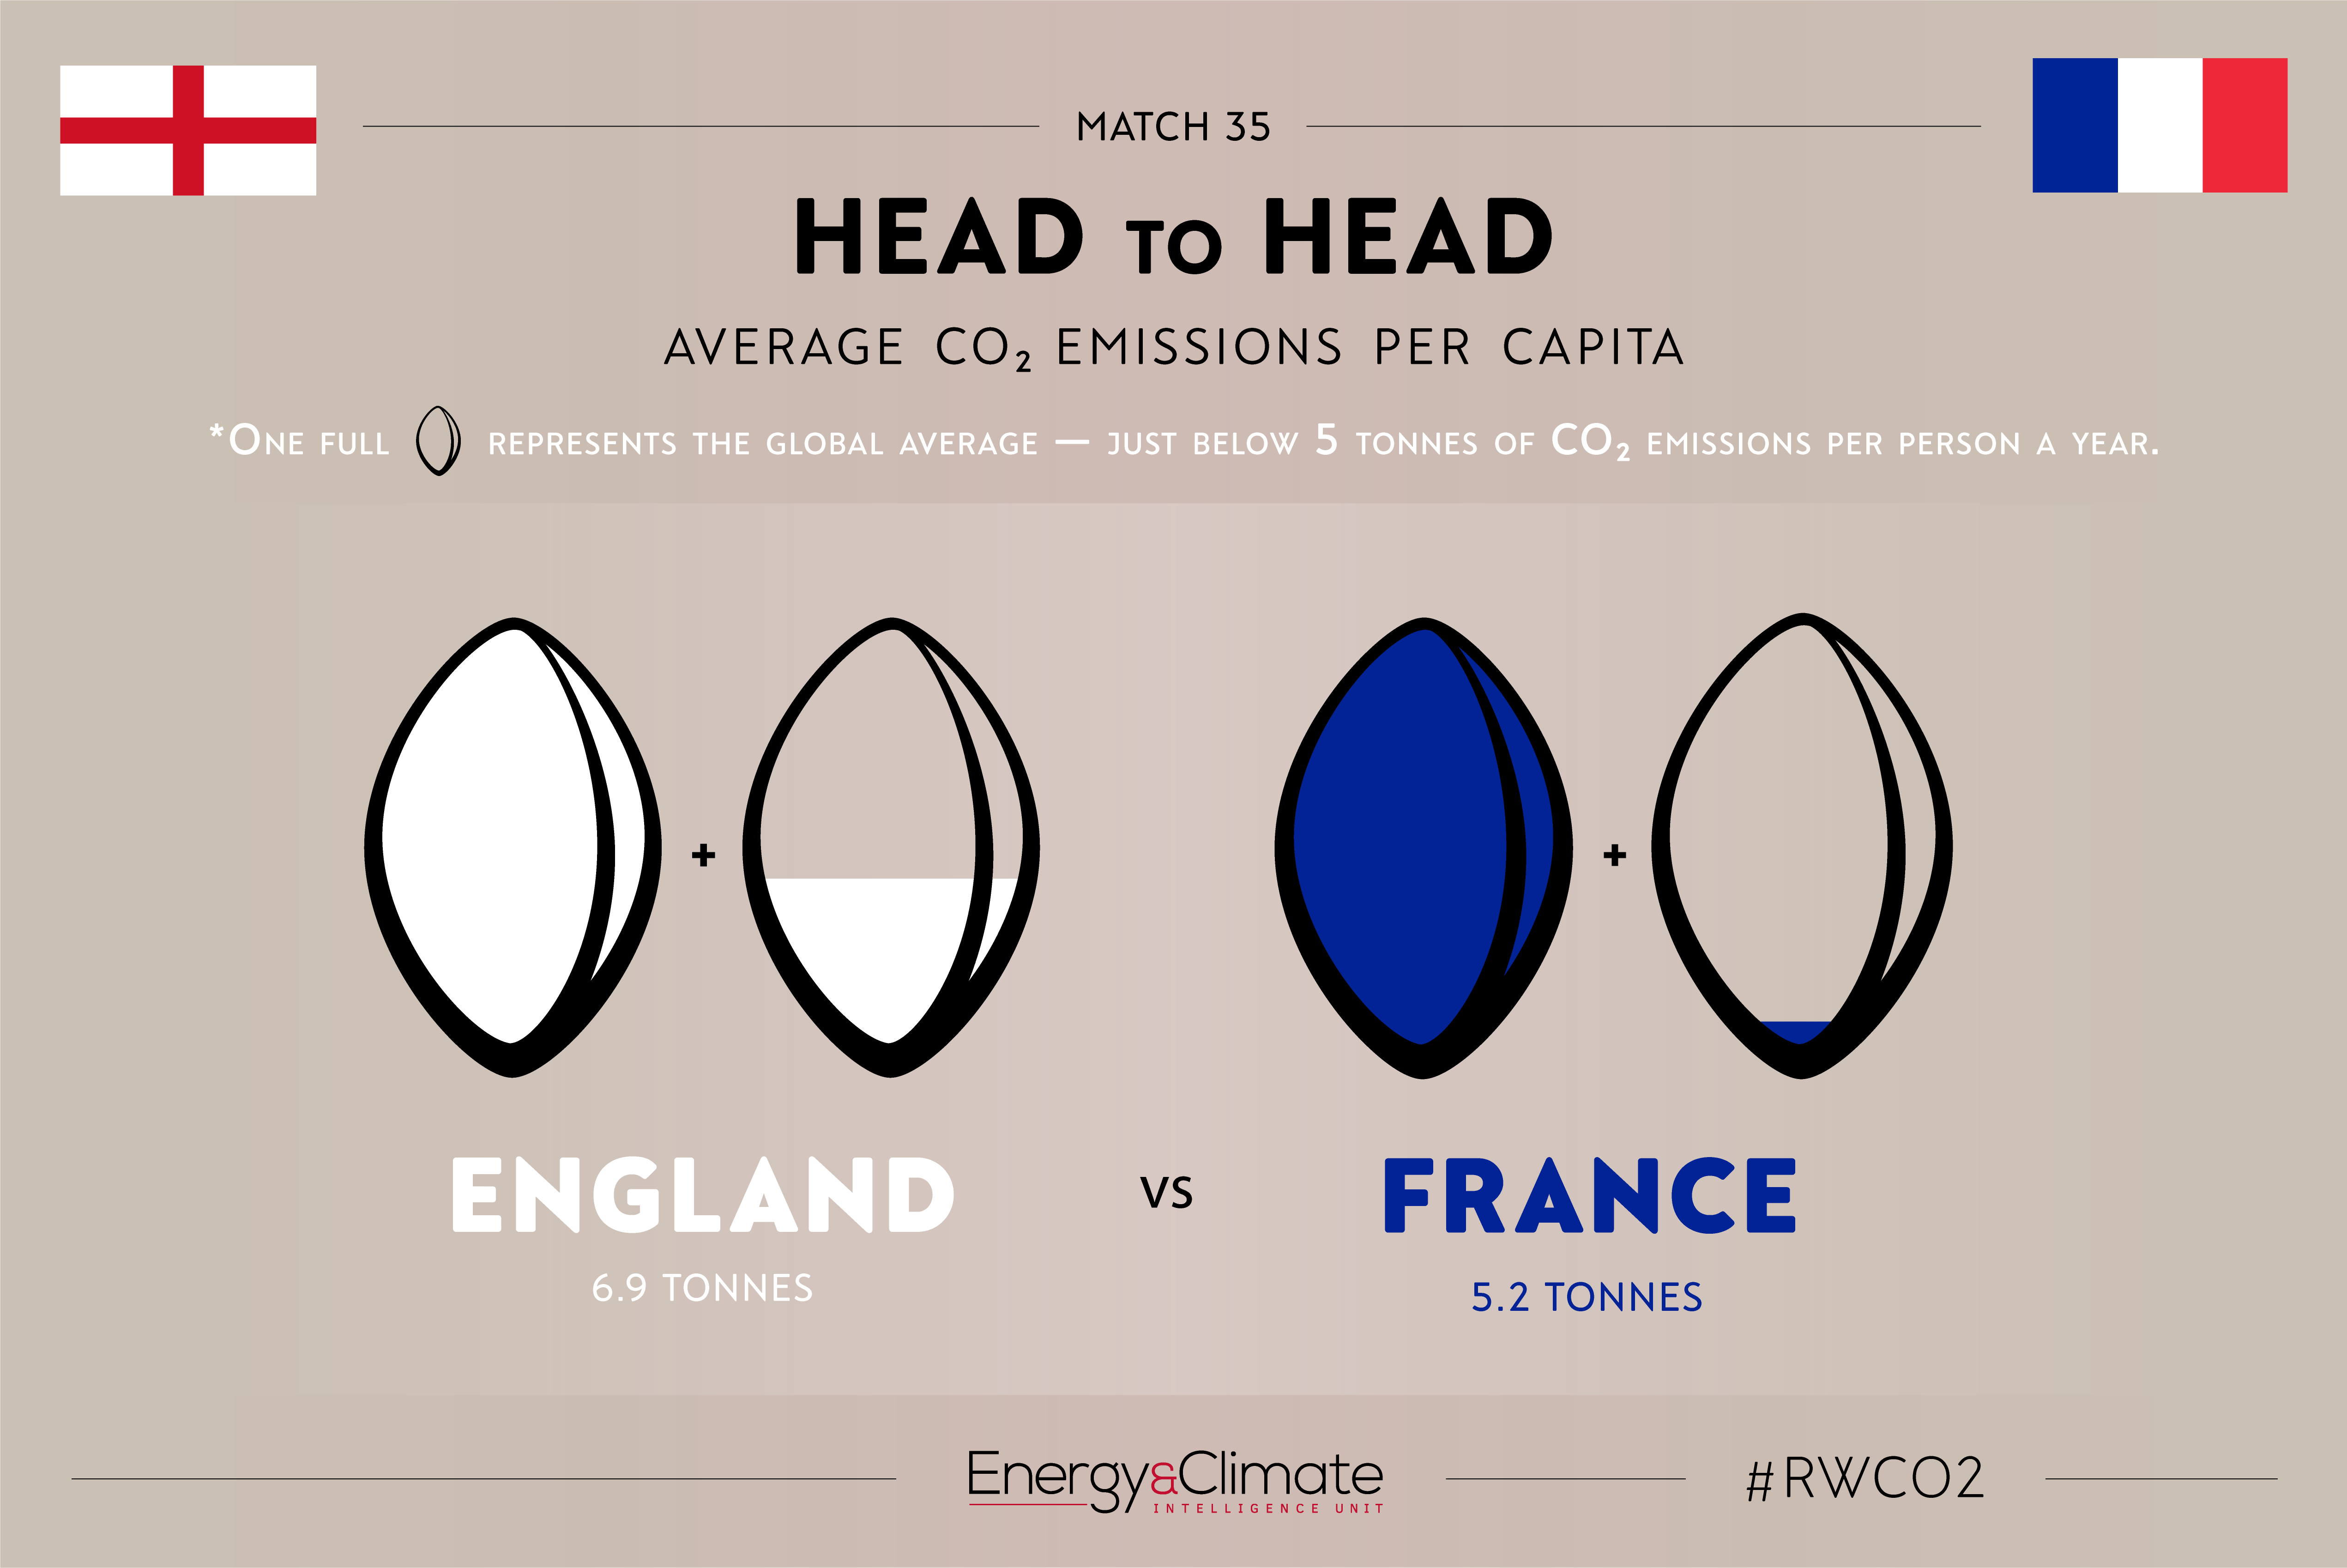
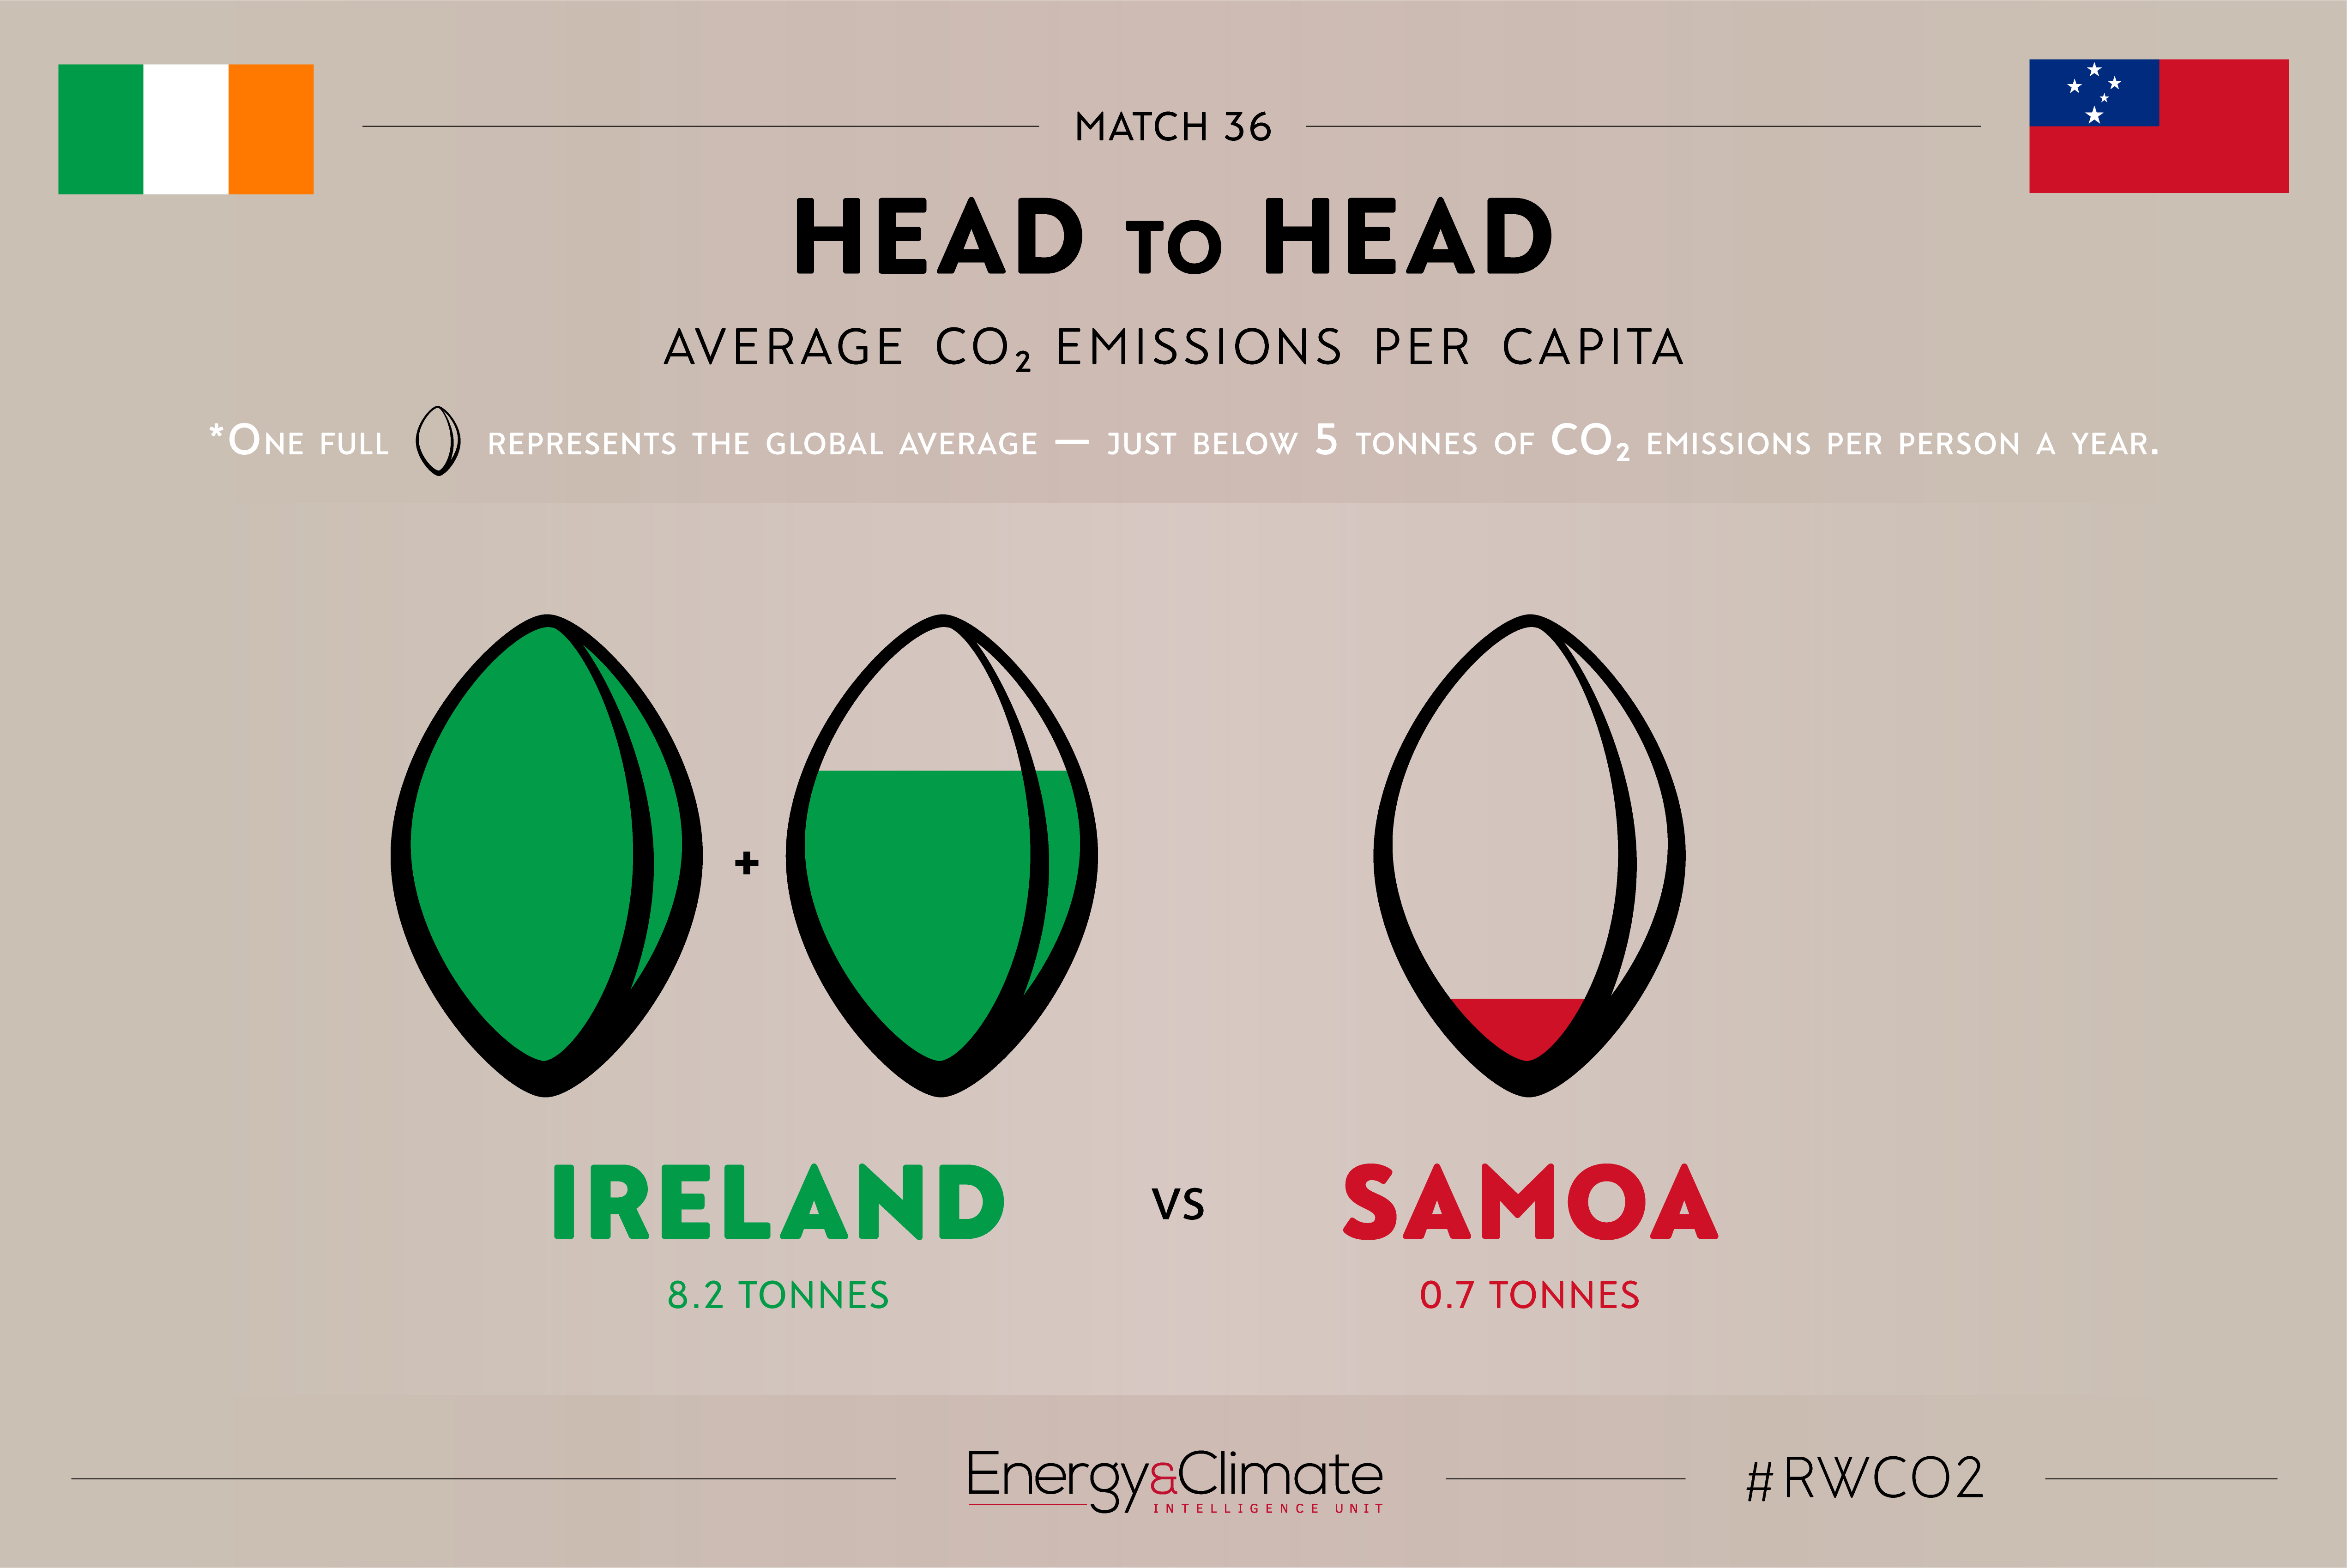
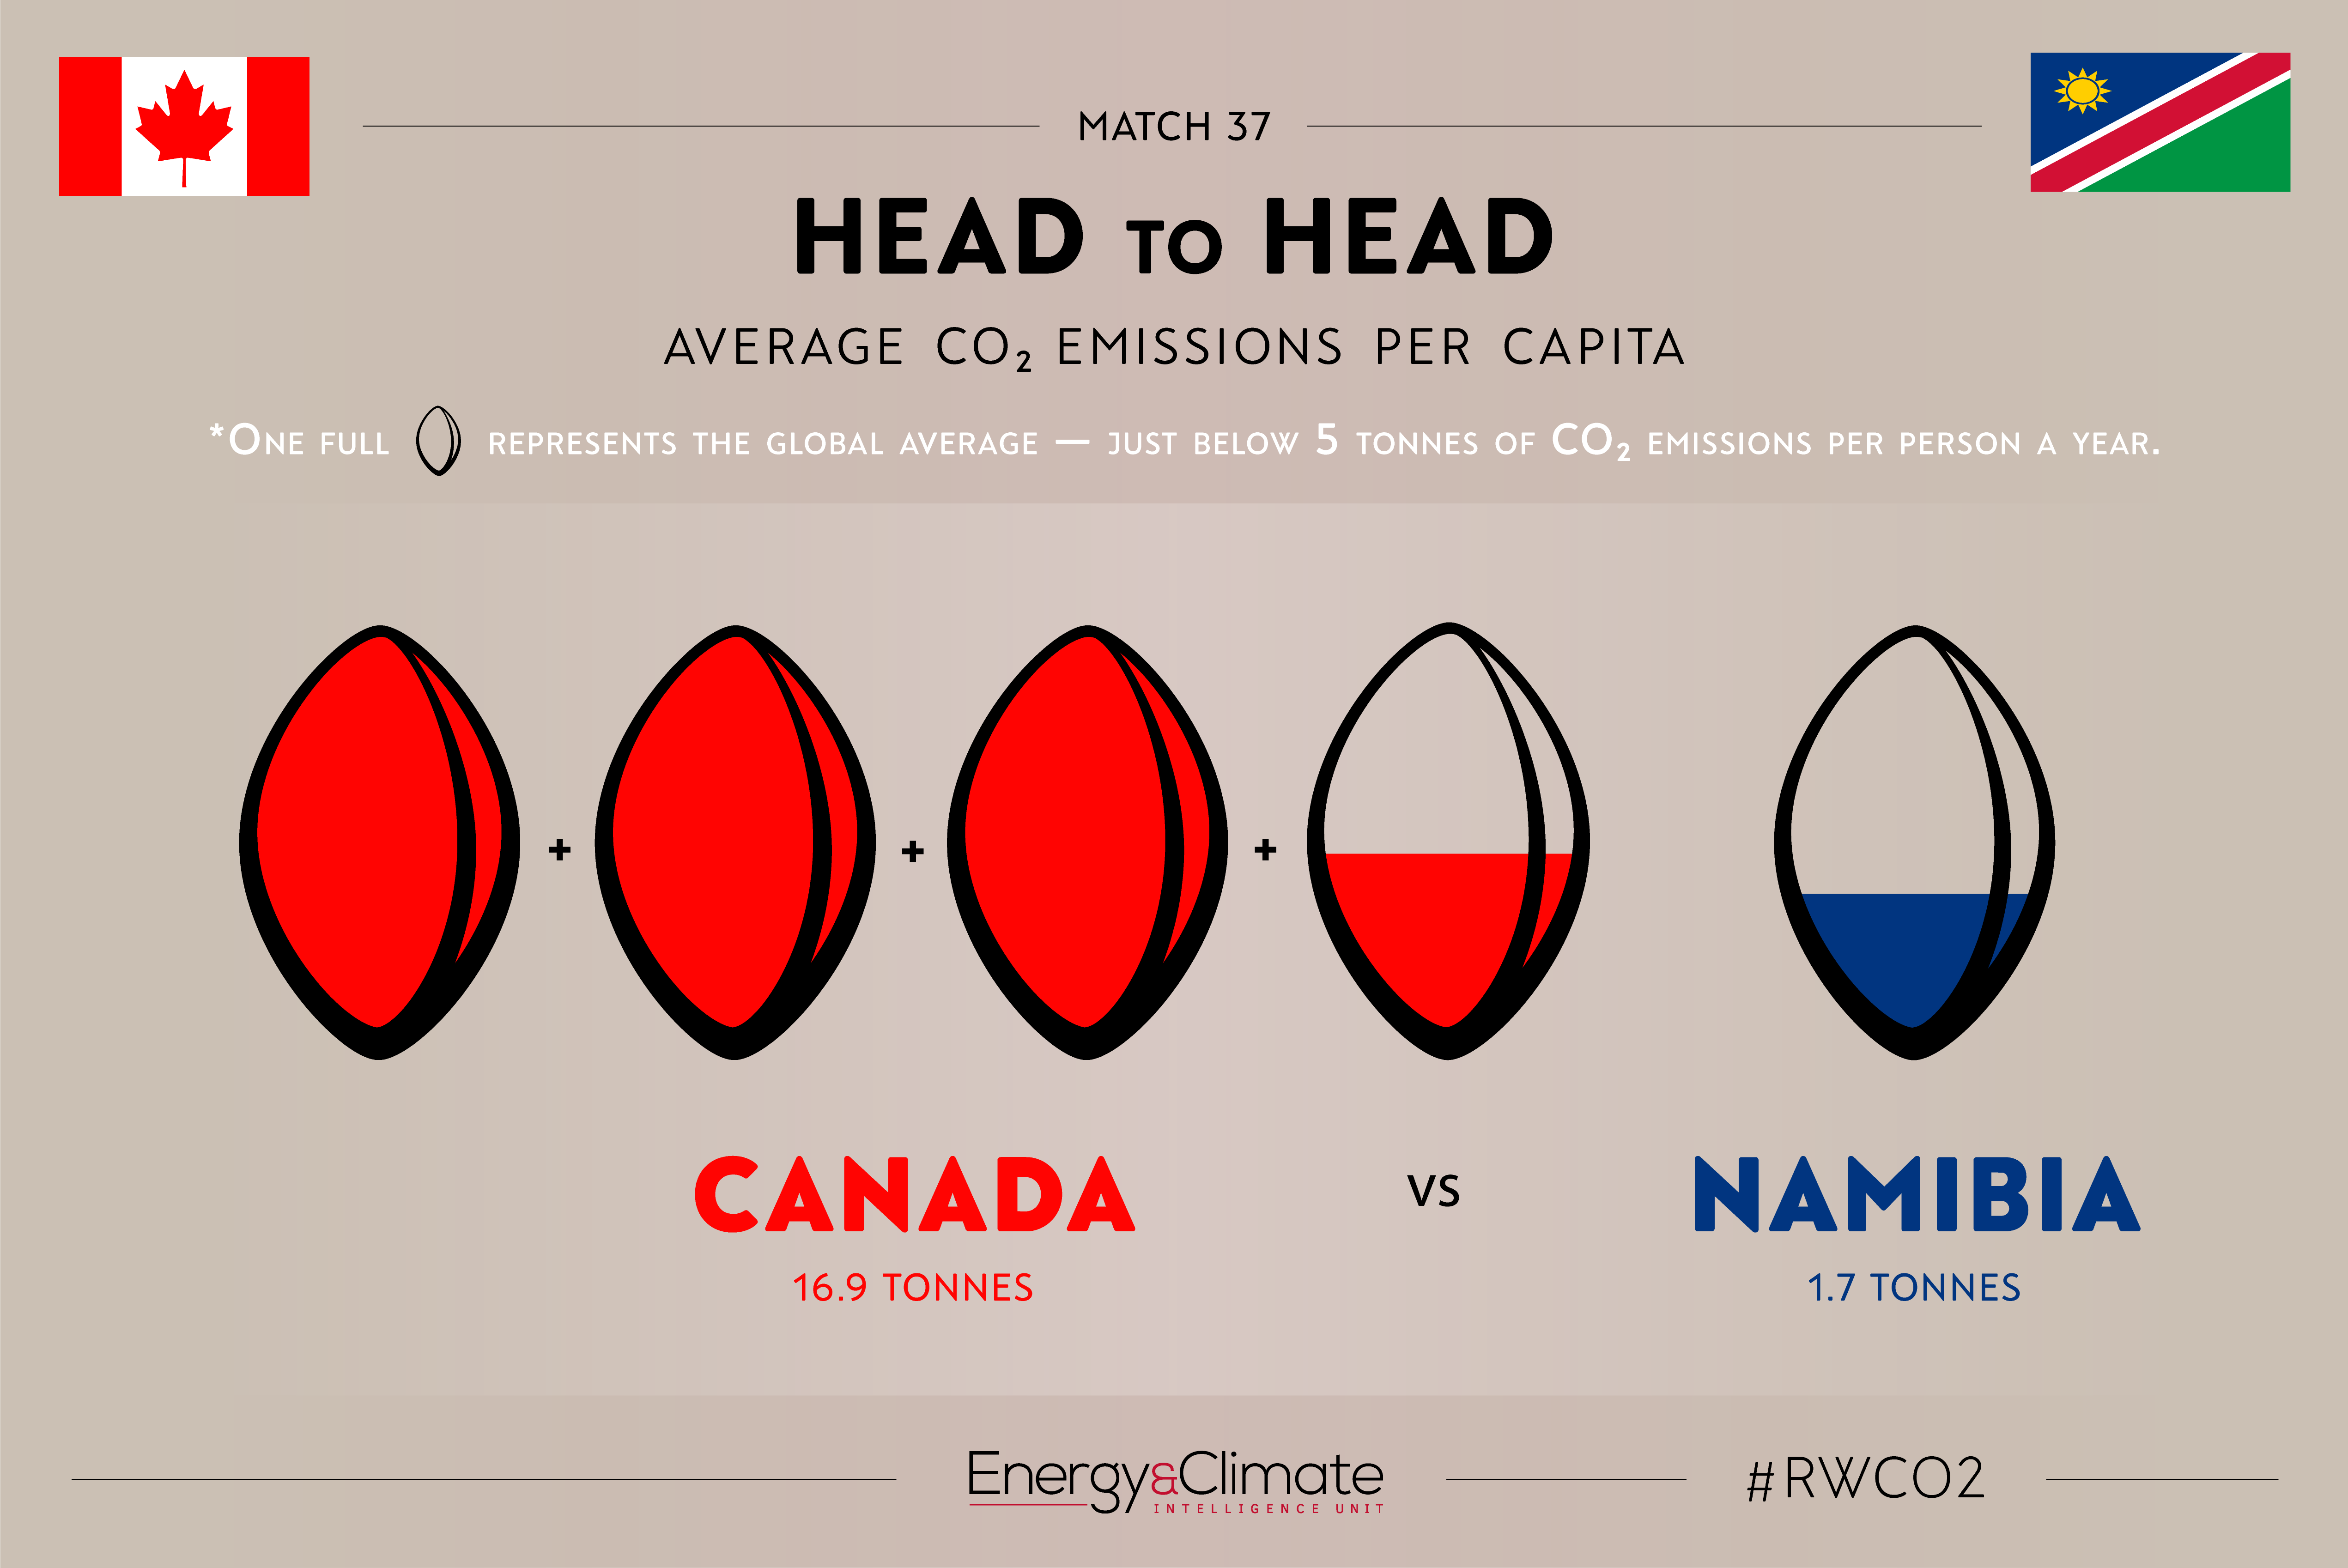
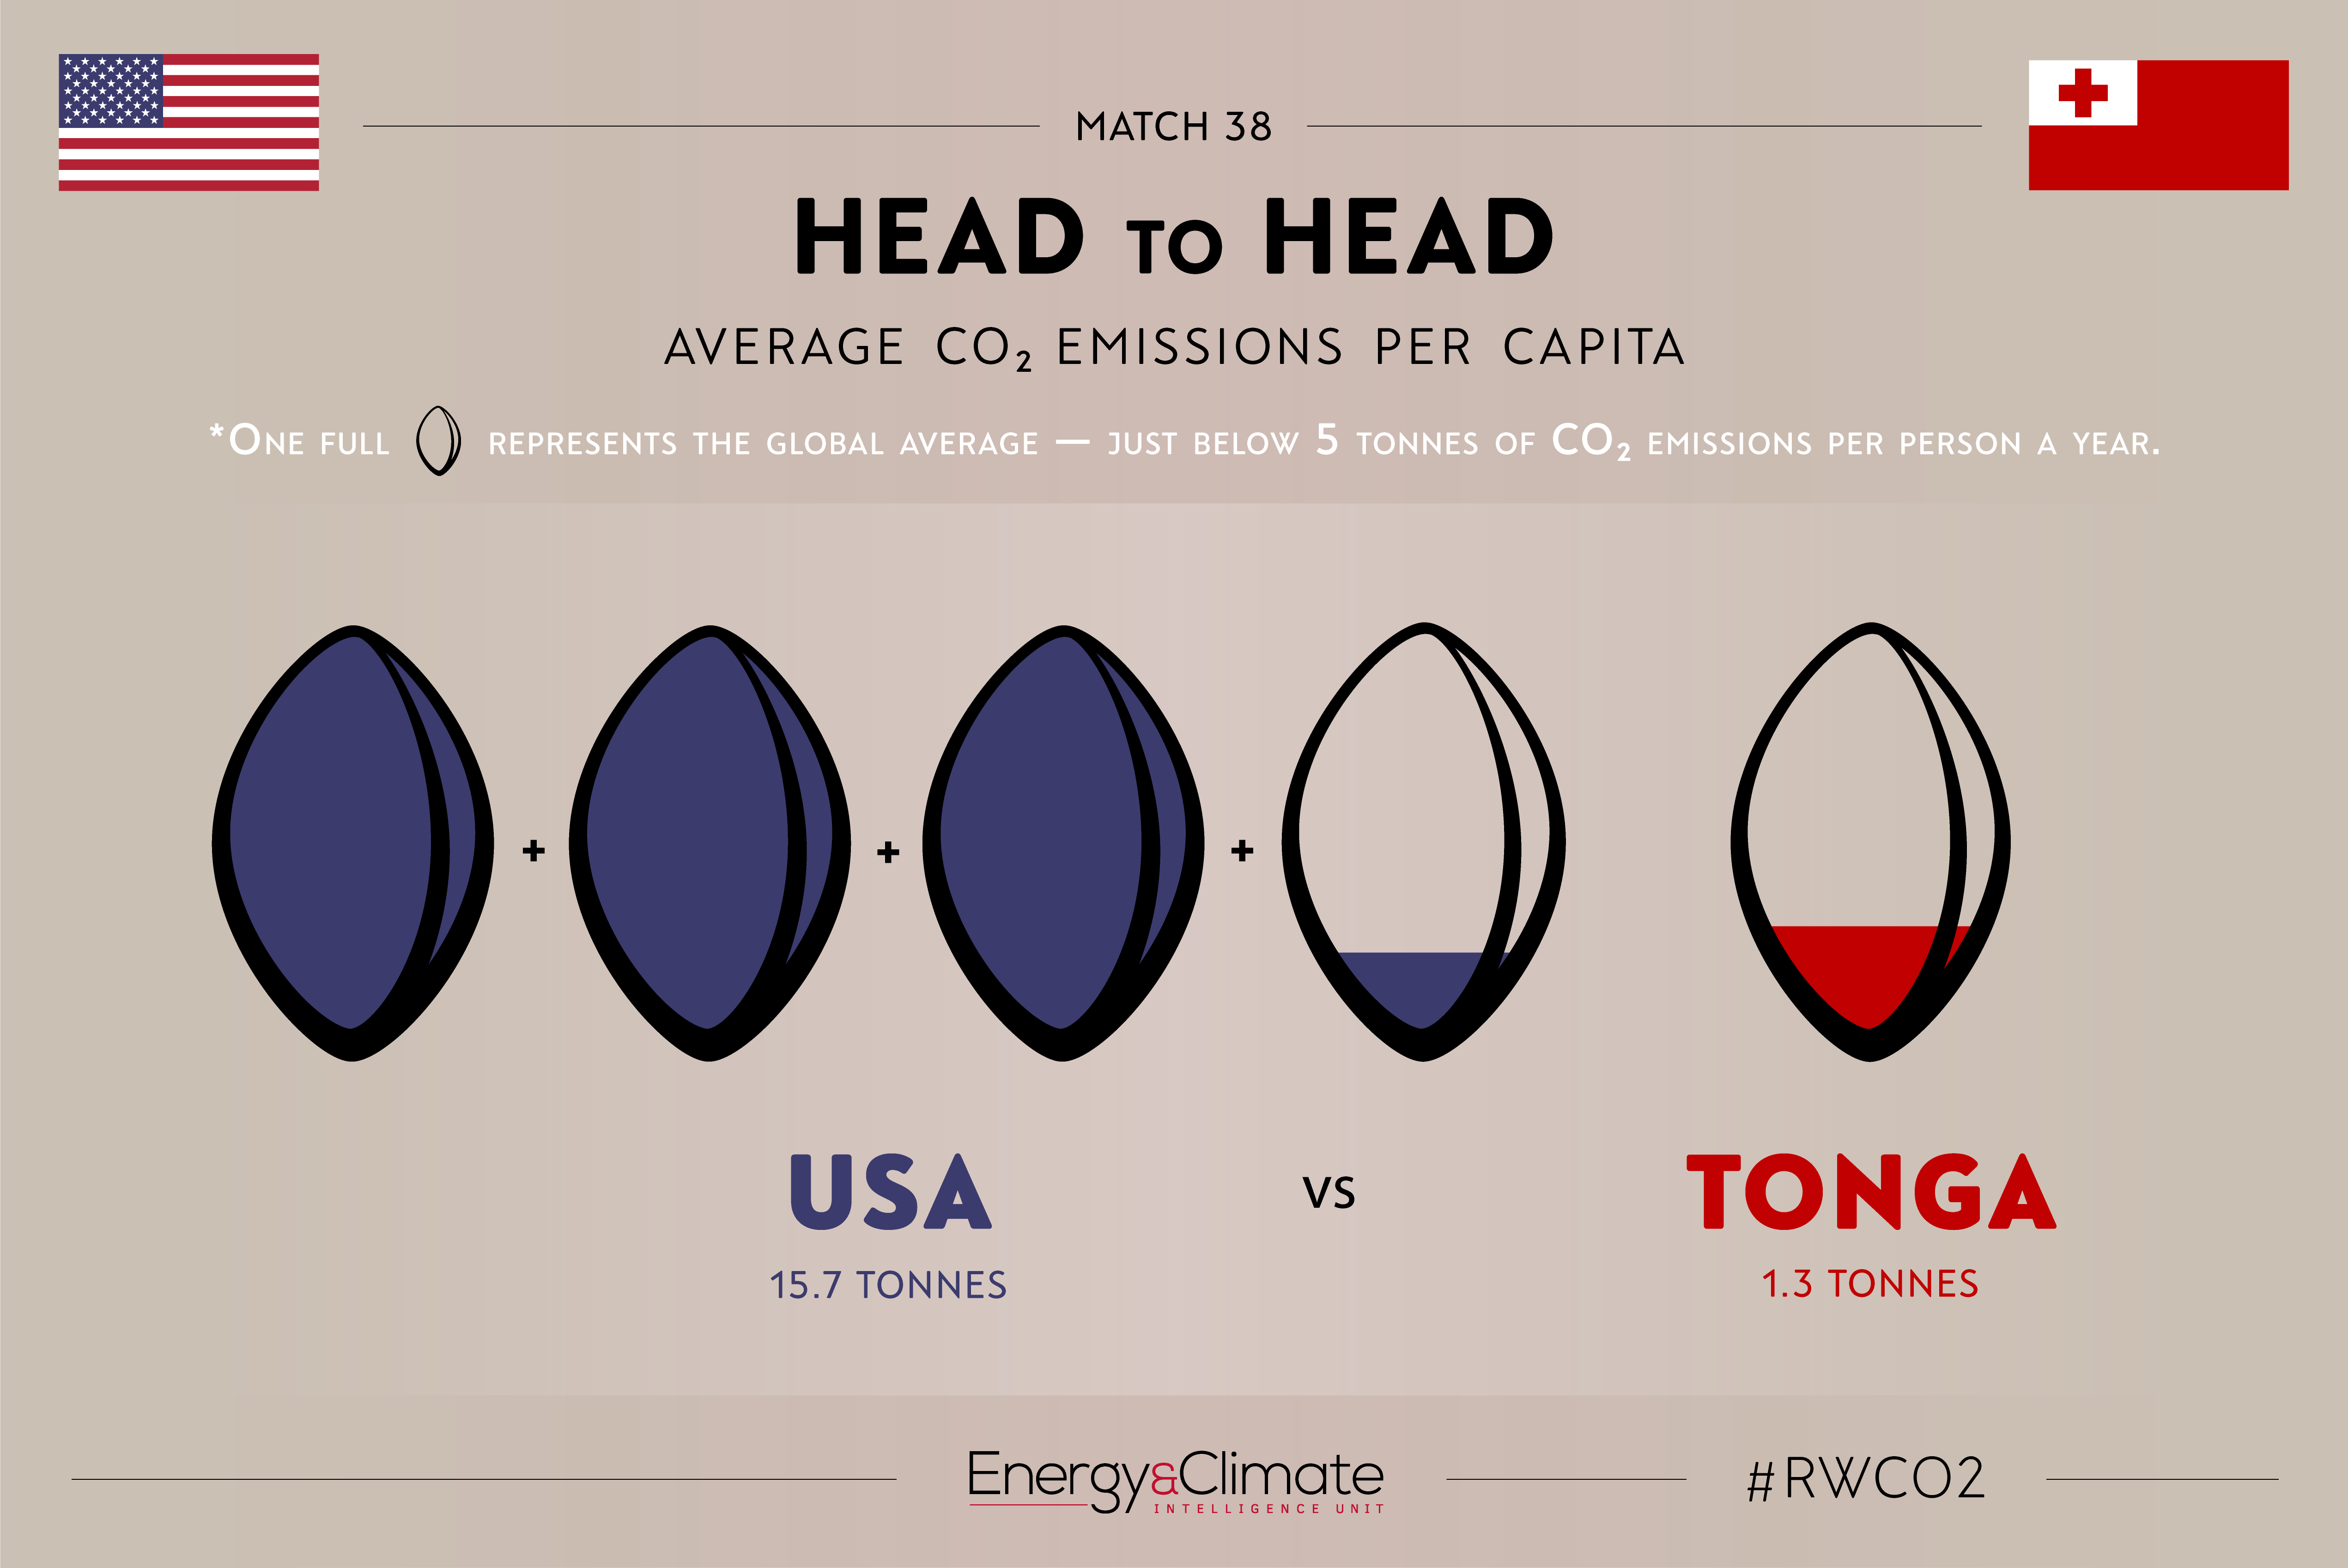
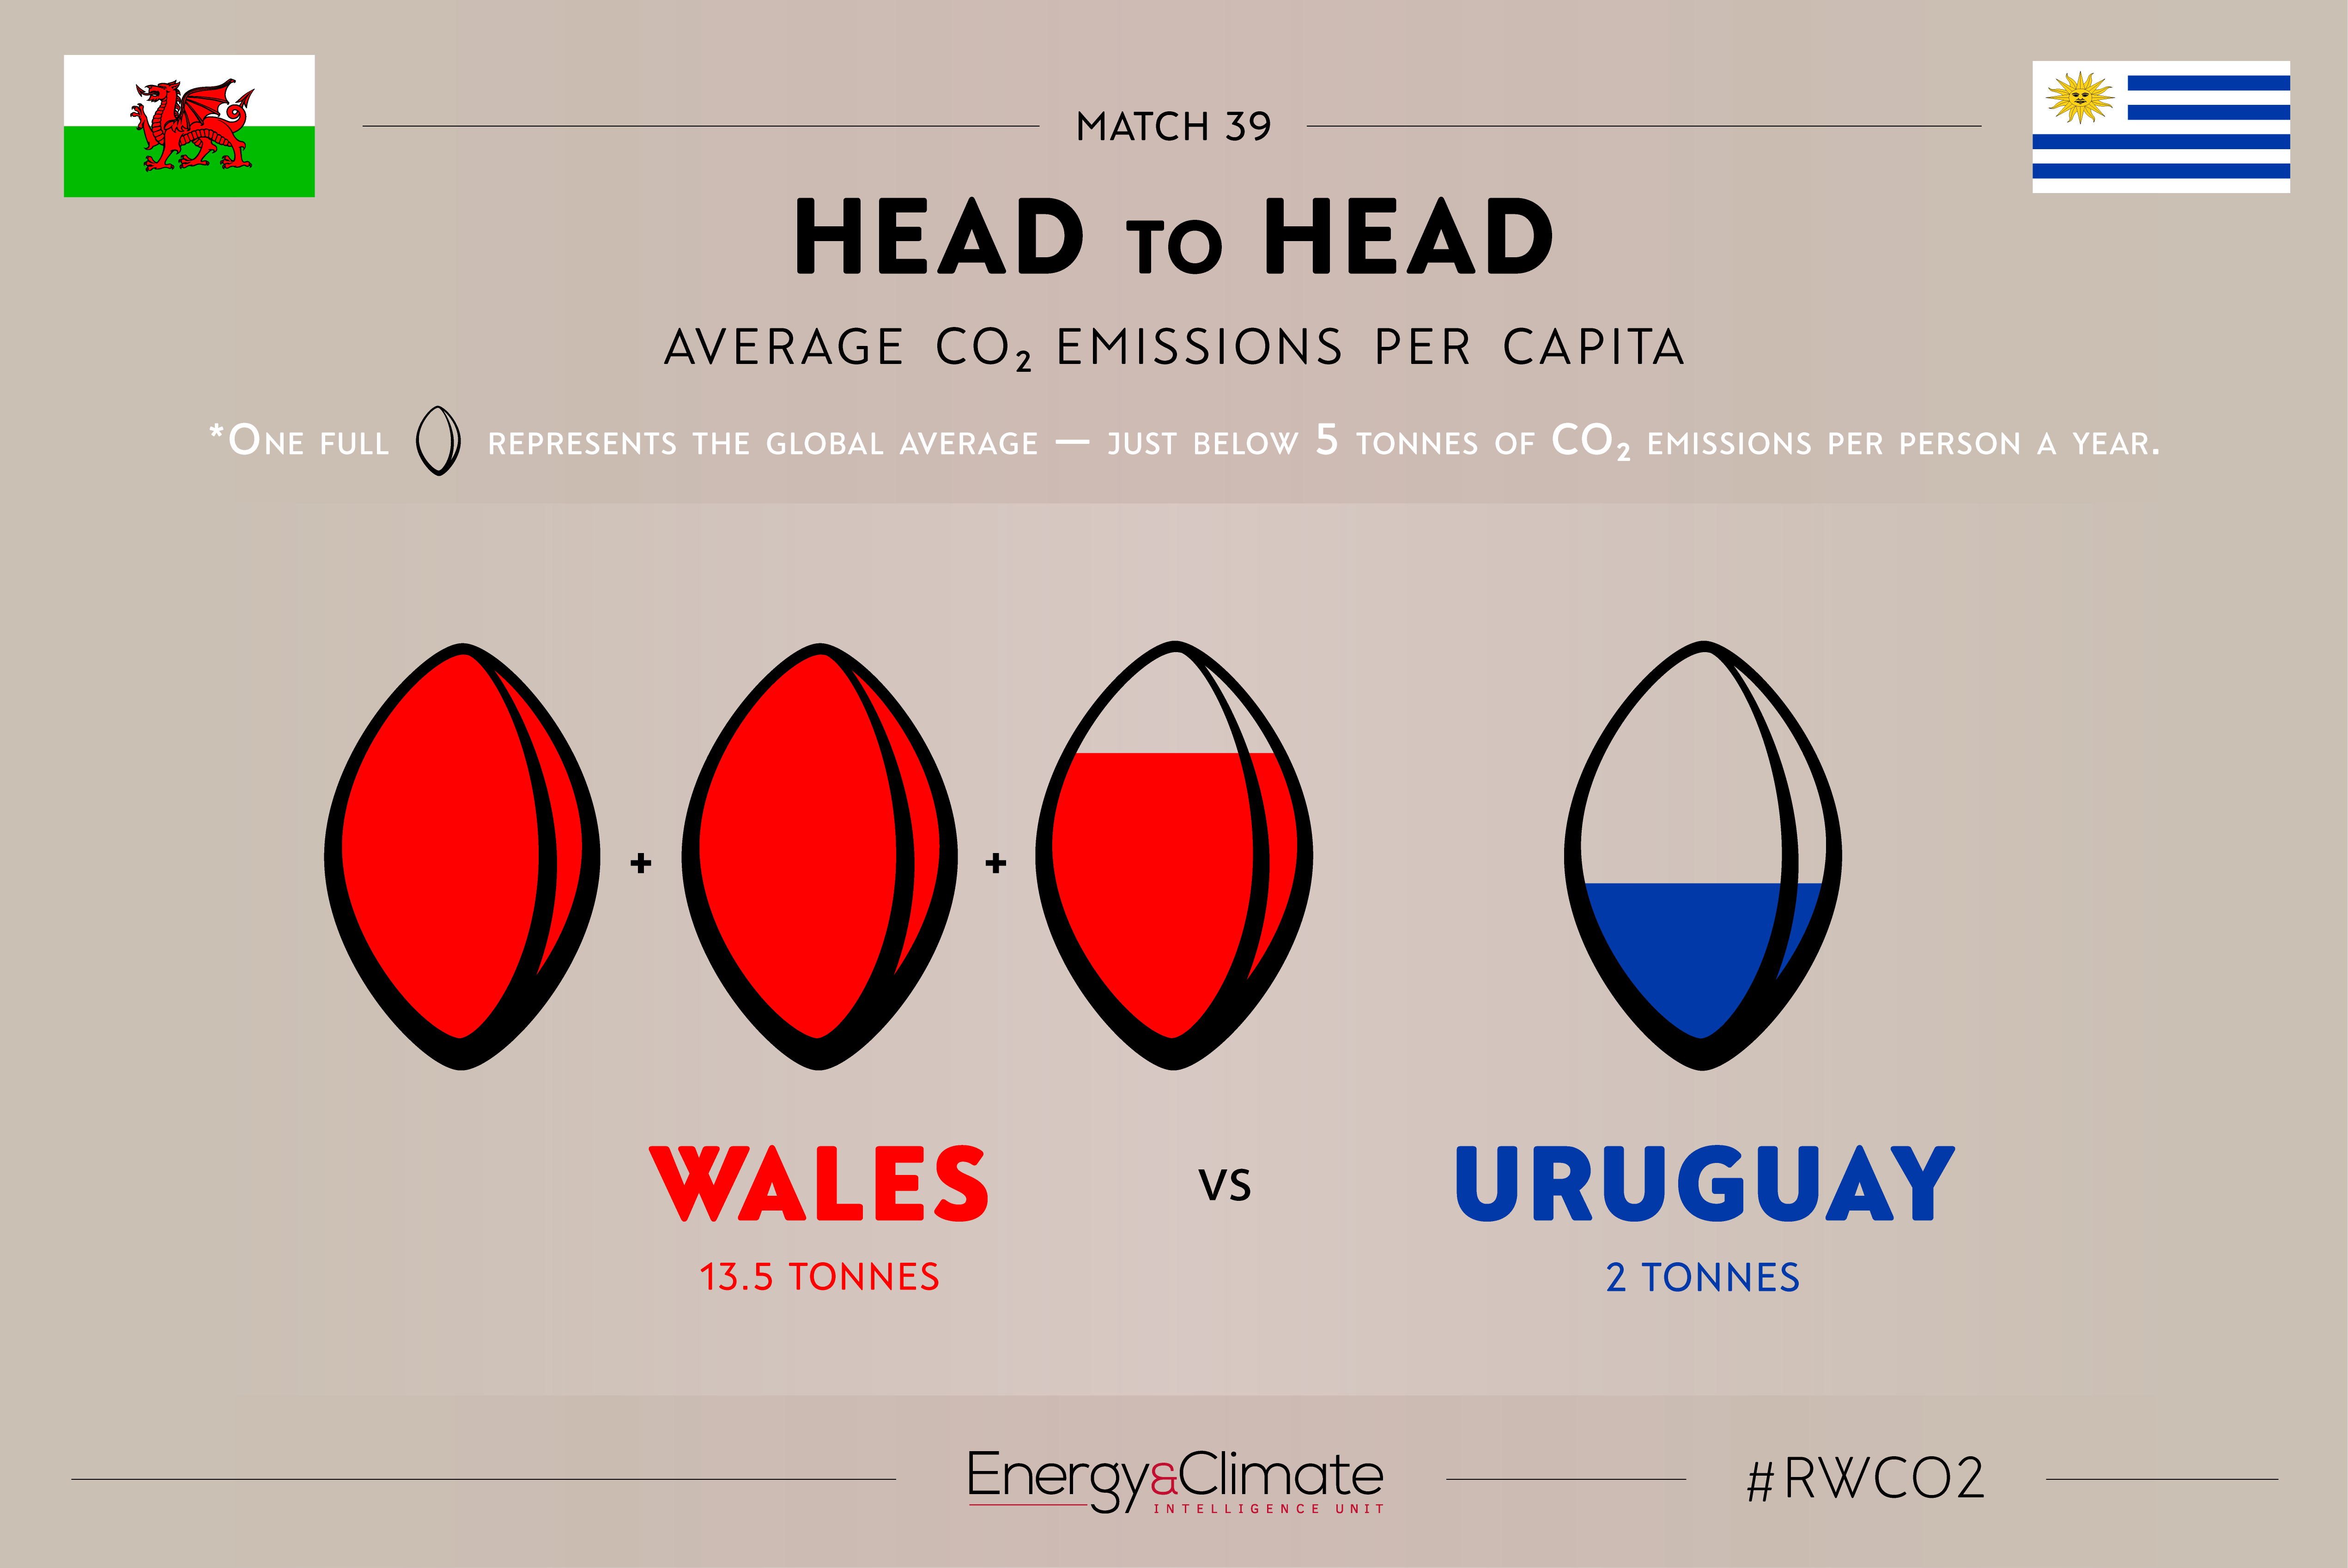
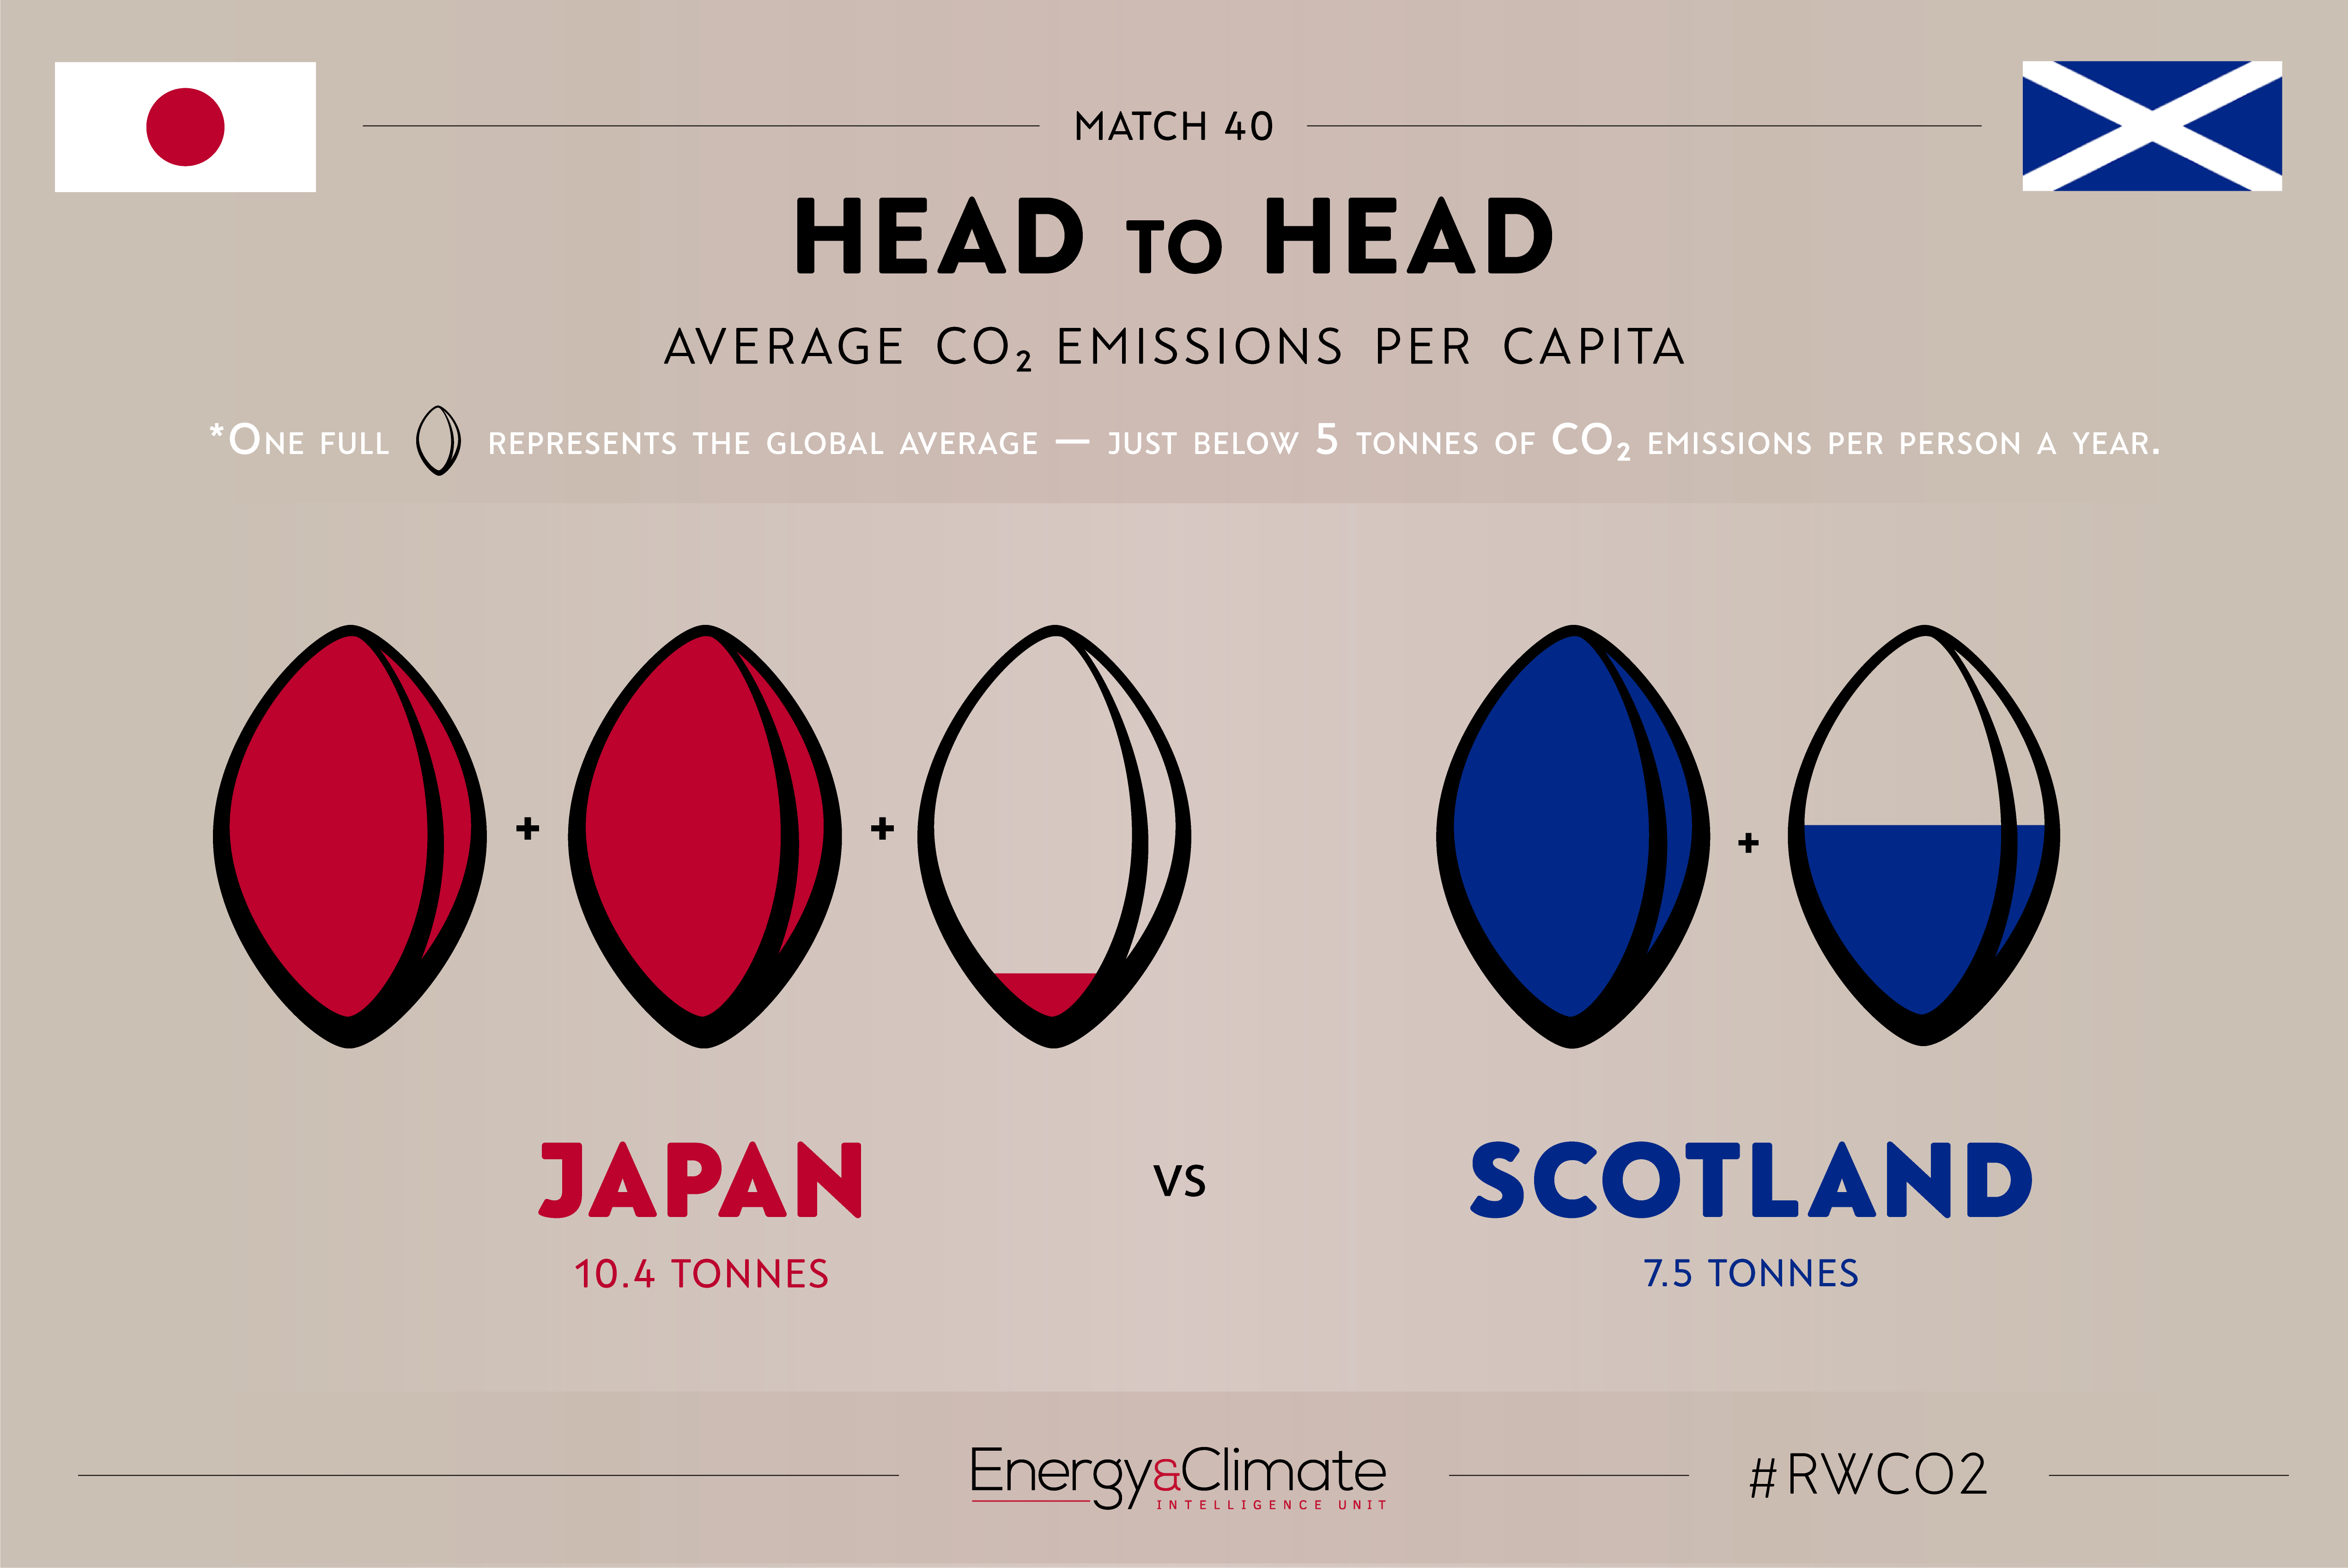
Which nations are good, and which are not so good. In climate terms.
This is part four of a five-part series — 10 Rugby World Cup games a pop. The next, and last, set of graphics will come out on the eve of the final. Call me biased — I’ve already inserted the All Blacks in as one of the finalists.
If I can nab the time, I’ll write a wrap up, in which I’ll discuss the reasons that, for example, France has much lower per capita emissions than Australia, or even their bitter rivals, England.
1. Head to Head: Part one of #RWCO2
2. Head to Head: Part two of #RWCO2
3. Head to Head: Part three of #RWCO2
If you’d like to see this series live, keep tabs on it via the Energy and Climate Intelligence Unit’s Twitter feed: @ECIU_UK (or mine, @johnlangab)
Up the ABs.